


Analysis of the previous deals:
30M chart of the EUR/USD pair
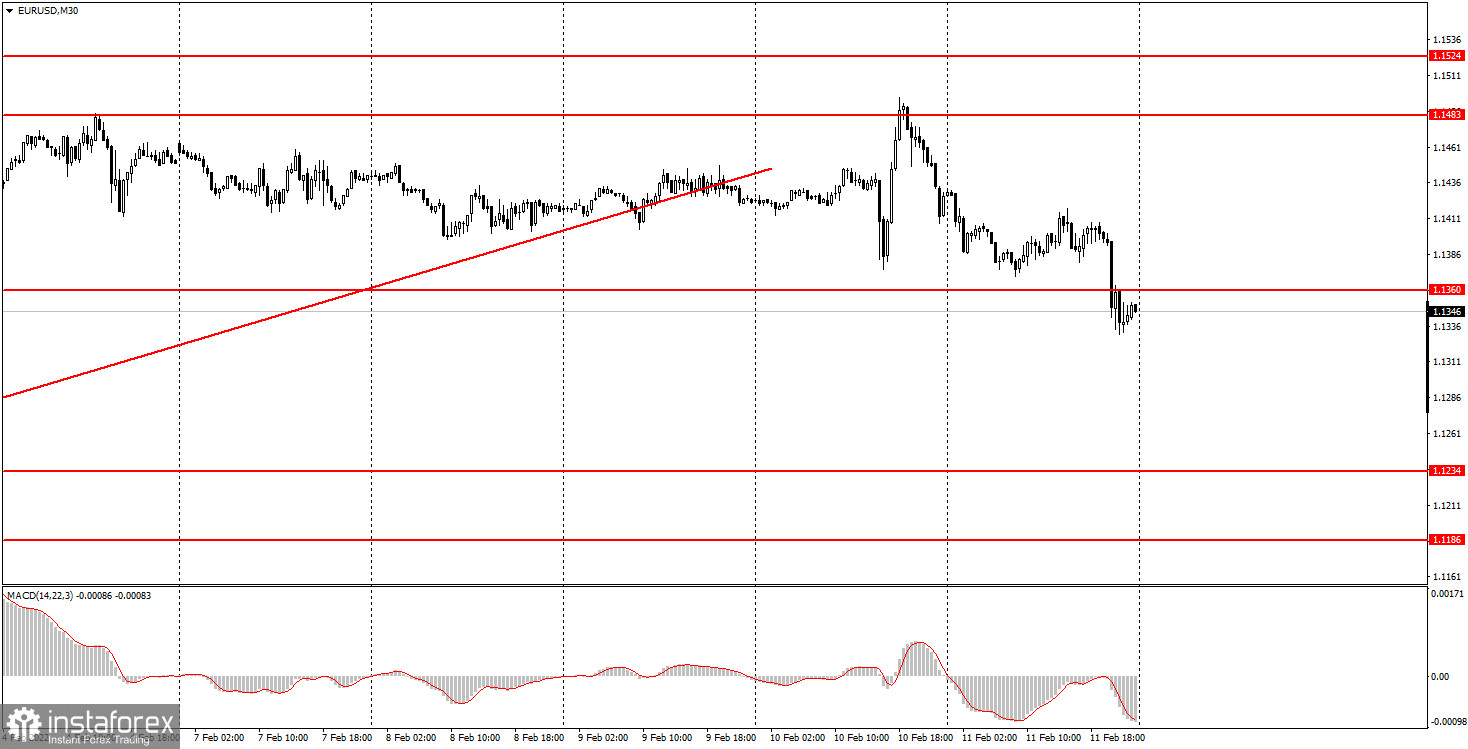
The EUR/USD currency pair was not trading in the best way again on Friday. Firstly, the markets have not yet moved past the report on US inflation, which was published on Thursday. Secondly, the very nature of the movement was not the best. It should be noted right away that the US inflation report was the key this week and caused strong, volatile movements. They are very clearly visible in the chart above. As you can see, the pair initially fell, then grew, then fell even more. This means that the reaction to the report was overlapped by other factors, possibly of a technical nature. In particular, large pending short positions could be placed near the level of 1.1483, and when the price reached this level, they worked. There is nothing else to explain the "swing" on Thursday. It is also very difficult to explain why the dollar was falling immediately after the report, and not growing. Thus, the market is now unbalanced, which affects both the movements and the quality of trading signals. Important macroeconomic statistics have not been published either in the US or in the EU. The only report of the day – the consumer sentiment index in the US was supposed to provoke a fall in the dollar, but at that time the US currency was just growing.
5M chart of the EUR/USD pair
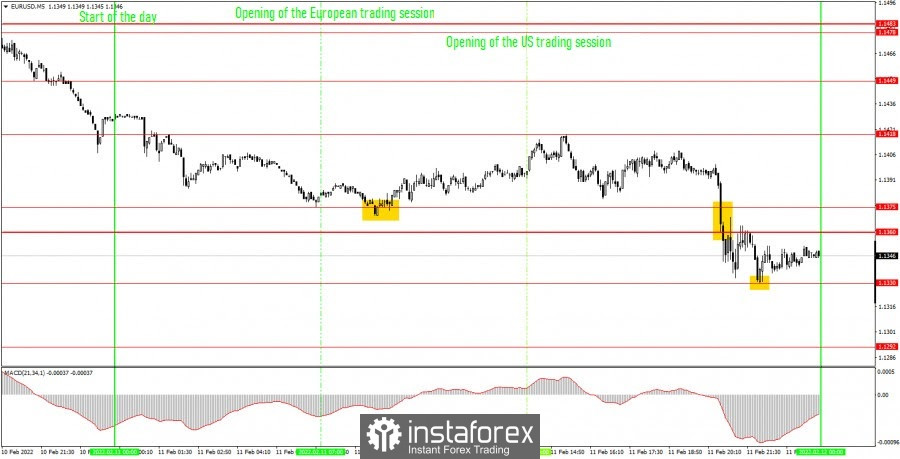
The movement also doesn't look that good on the 5-minute timeframe. During the day, traders could not come to a common opinion on the question of what to do with the euro/dollar pair. But it's good that there weren't very many signals, otherwise most of them would have been false. The first buy signal was formed when the price rebounded from the level of 1.1375. After that, the price went up about 35 points and was not far from the level of 1.1418 almost until the evening. Therefore, novice traders had plenty of time to close long positions in profit. By the way, the level of 1.1418 has not been on the charts yet, since this is the peak of Friday. Although a rather formal peak. The next signal - for short positions - was formed a few hours before the market closed, in the evening, so it clearly should not have been traded. The price settled below the levels of 1.1375 and 1.1360, and also reached the level of 1.1330. It seems to be a pretty good signal, but it was formed too late. And besides, it is very difficult to explain what caused such a movement of the pair a few hours before the market closed. Moreover, the pound/dollar pair was also falling at that time.
How to trade on Monday:
The upward trend persists on the 30-minute timeframe, but it remains purely formal. The price again failed to overcome the level of 1.1483, and earlier it settled below the ascending trend line, so the pair's prospects are now descending. In addition, the fundamental background also speaks in favor of the euro's decline, since the European Central Bank has again shown its passivity and unwillingness to raise the key rate. On the 5-minute TF tomorrow, it is recommended to trade by levels 1.1279-1.1292, 1.1330, 1.1360-1.1375, 1.1418, 1.1449. When passing 15 points in the right direction, you should set the Stop Loss to breakeven. On Monday, there will be absolutely nothing to pay attention to in either the United States or in the European Union. The event calendar is empty. Thus, volatility may be weak tomorrow.
Basic rules of the trading system:
1) The signal strength is calculated by the time it took to form the signal (bounce or overcome the level). The less time it took, the stronger the signal.
2) If two or more deals were opened near a certain level based on false signals (which did not trigger Take Profit or the nearest target level), then all subsequent signals from this level should be ignored.
3) In a flat, any pair can form a lot of false signals or not form them at all. But in any case, at the first signs of a flat, it is better to stop trading.
4) Trade deals are opened in the time period between the beginning of the European session and until the middle of the American one, when all deals must be closed manually.
5) On the 30-minute TF, using signals from the MACD indicator, you can trade only if there is good volatility and a trend, which is confirmed by a trend line or a trend channel.
6) If two levels are located too close to each other (from 5 to 15 points), then they should be considered as an area of support or resistance.
On the chart:
Support and Resistance Levels are the Levels that serve as targets when buying or selling the pair. You can place Take Profit near these levels.
Red lines are the channels or trend lines that display the current trend and show in which direction it is better to trade now.
The MACD indicator (14,22,3) consists of a histogram and a signal line. When they cross, this is a signal to enter the market. It is recommended to use this indicator in combination with trend lines (channels and trend lines).
Important speeches and reports (always contained in the news calendar) can greatly influence the movement of a currency pair. Therefore, during their exit, it is recommended to trade as carefully as possible or exit the market in order to avoid a sharp price reversal against the previous movement.
Beginners on Forex should remember that not every single trade has to be profitable. The development of a clear strategy and money management are the key to success in trading over a long period of time.


