


Long positions on EUR/USD:
In my forecast this morning, I drew your attention to several support levels. Let's look at the 5-minute chart and see what happened. A false breakout at 1.1333 created a good buy signal for the euro, but after the pair rose by 10 pips, the pressure on the trading instrument returned. Bears broke through 1.1333, but there was no sell signal to test that level. In such circumstances, we had to wait for the test of 1.1303, and it happened. There was another false breakout and a buy signal. At the time of writing, the pair jumped by 20 pips, and that is the end of bullish momentum.
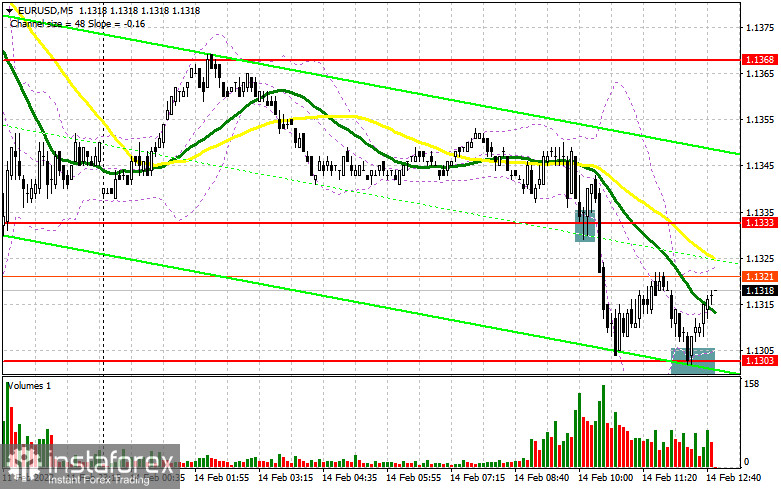
The Board of Governors of the Federal Reserve System is expected to meet in closed session today at 19:30 MSK. It will be held in accordance with the accelerated procedures. At the meeting it is planned to consider the issue of monetary policy changes, in other words - interest rates will be raised. Considering that the meeting is unscheduled, the rates will be raised at least by 0.5%. In case of more hawkish policy changes, we can expect further decline of the euro in the short term. Market participants are likely to postpone opening long positions in such circumstances as it is better not to rush with buying the currency. The best scenario to buy the euro would be another false breakout at 1.1303. Fundamental data on the US economy is expected today, the emphasis is likely to be put on the Fed meeting. Bulls need to regain control over the level of 1.1339 during the US session, which was gained after the first half of the day. Above this level there are the moving averages, which are ready to prevent a larger recovery of the pair. A breakthrough of 1.1339 and a reverse test top/bottom may give an additional signal to buy the euro and it will open the way to the recovery to the area of 1.1375. However, it is unlikely that there will be a bigger increase after the Fed meeting. Only the breakout and the test of 1.1375 will open the way to 1.1407 and 1.1452, where I recommend to take profits. With a further decline in the pair during the US session and lack of activity at 1.1303, and most likely one more test this area will not hold, it is better to postpone purchases to 1.1269. However, traders may open long positions there, if a false breakout occurs. Traders may buy the euro on the rebound against the bear market from the level of 1.1235, or even lower - around 1.1200 allowing an upward intraday correction of 20-25 pips.
Short positions on EUR/USD:
The sellers still control the market, especially considering the news today. The speech of FOMC member James Bullard is unlikely to seriously affect the market, so the whole focus is on the final statement of the Fed. We are unlikely to see bulls trying to regain control of 1.1339 during the US session, but if they do, bears should take measures. If the price moves above 1.1339, it may bring the buyers back into the market. The formation of a false breakout at 1.1339 and a more aggressive interest rate hike from the central bank will all increase the pressure on the pair and form an entry point for opening short positions, with the target at 1.1303, where bear market had a small halt in the morning. A breakout and a reverse test bottom/top of this range will give an additional signal for opening of short positions with the prospect of falling to a low at 1.1269, and a further target is located at 1.1235, where traders can take profits. If the euro grows and bears show lack of activity at 1.1339, it is better to postpone selling the pair. Opening of short positions would be optimal if a false breakout at the highs of 1.1375 occurs. It is possible to sell the EUR/USD pair immediately on a rebound from a high of 1.1407, or even higher around 1.1452 allowing a downward correction of 15-20 pips.
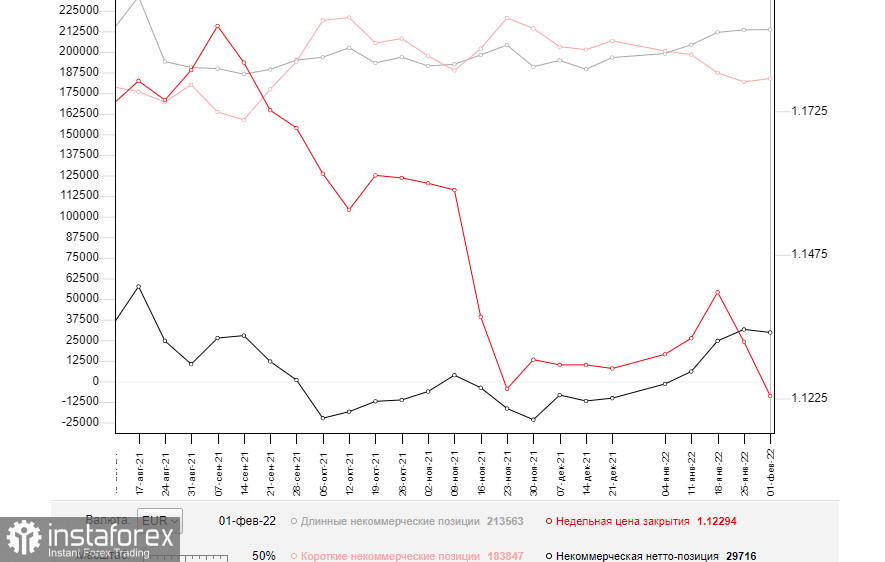
The COT (Commitment of Traders) report for February 1 reflected an increase in both long and short positions, and the latter were slightly prevailing. This led to a slight decrease in the positive delta. However, the data does not take into account the European Central Bank meeting, where President Christine Lagarde said the regulator would act more aggressively in case the situation with high inflation does not change. As the latest data has shown, we should not wait for a slowdown in inflationary pressures. This is a strong bullish signal to buy the euro at the moment, as there is a real prospect of tight monetary policy and interest rate increase in the Eurozone this year. On the other hand, we should not forget about the interest rate hike from the Fed already in March which will be a bit of a deterrent factor for EUR/USD buyers. Some traders expect that the central bank might be more aggressive and raise rates by 0.5% at once instead of 0.25% - that would be a kind of bullish signal for the US dollar. The COT report indicates that long non-commercial positions rose to 213,563 from 213,408, while short non-commercial positions jumped to 183,847 from 181,848. This suggests traders continue to build up long positions, and a future report will clearly point to a strong bias towards buyers, as it will take into account the February ECB meeting results. At the end of the week, the total non-commercial net positioning was down slightly to 29,716 against 31,569. The weekly closing price was also lower at 1.1229 against 1.1323 a week earlier.
Indicators' signals:
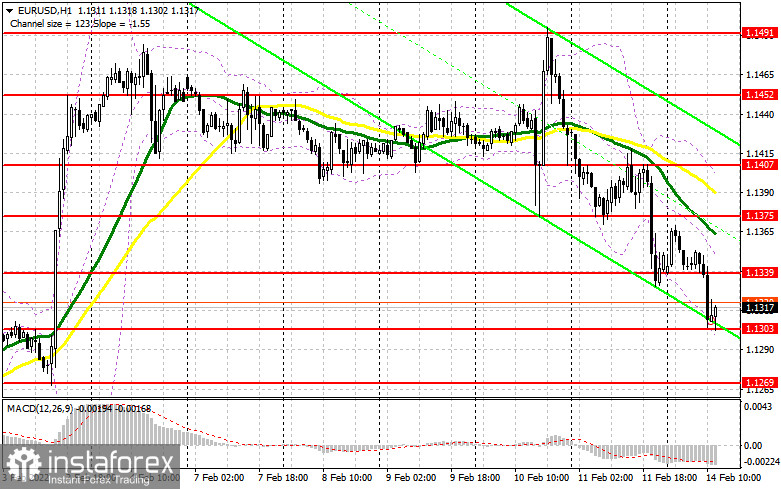
Trading is carried out below the 30 and 50 daily moving averages. It indicates that bears are ruling the market.
Moving averages
Note: The period and prices of moving averages are considered by the author on the H1 hourly chart and differs from the general definition of the classic daily moving averages on the daily D1 chart.
Bollinger Bands
In the case of growth the resistance will be located at the upper boundary of the indicator at 1.1400.
Description of indicators
- Moving average (moving average, determines the current trend by smoothing out volatility and noise). Period 50. It is marked yellow on the chart.
- Moving average (moving average, determines the current trend by smoothing out volatility and noise). Period 30. It is marked green on the chart.
- MACD indicator (Moving Average Convergence/Divergence — convergence/divergence of moving averages) Quick EMA period 12. Slow EMA period to 26. SMA period 9
- Bollinger Bands (Bollinger Bands). Period 20
- Non-commercial speculative traders, such as individual traders, hedge funds, and large institutions that use the futures market for speculative purposes and meet certain requirements.
- Long non-commercial positions represent the total long open position of non-commercial traders.
- Short non-commercial positions represent the total short open position of non-commercial traders.
- Total non-commercial net position is the difference between short and long positions of non-commercial traders.


