What is needed to open long positions on GBP/USD
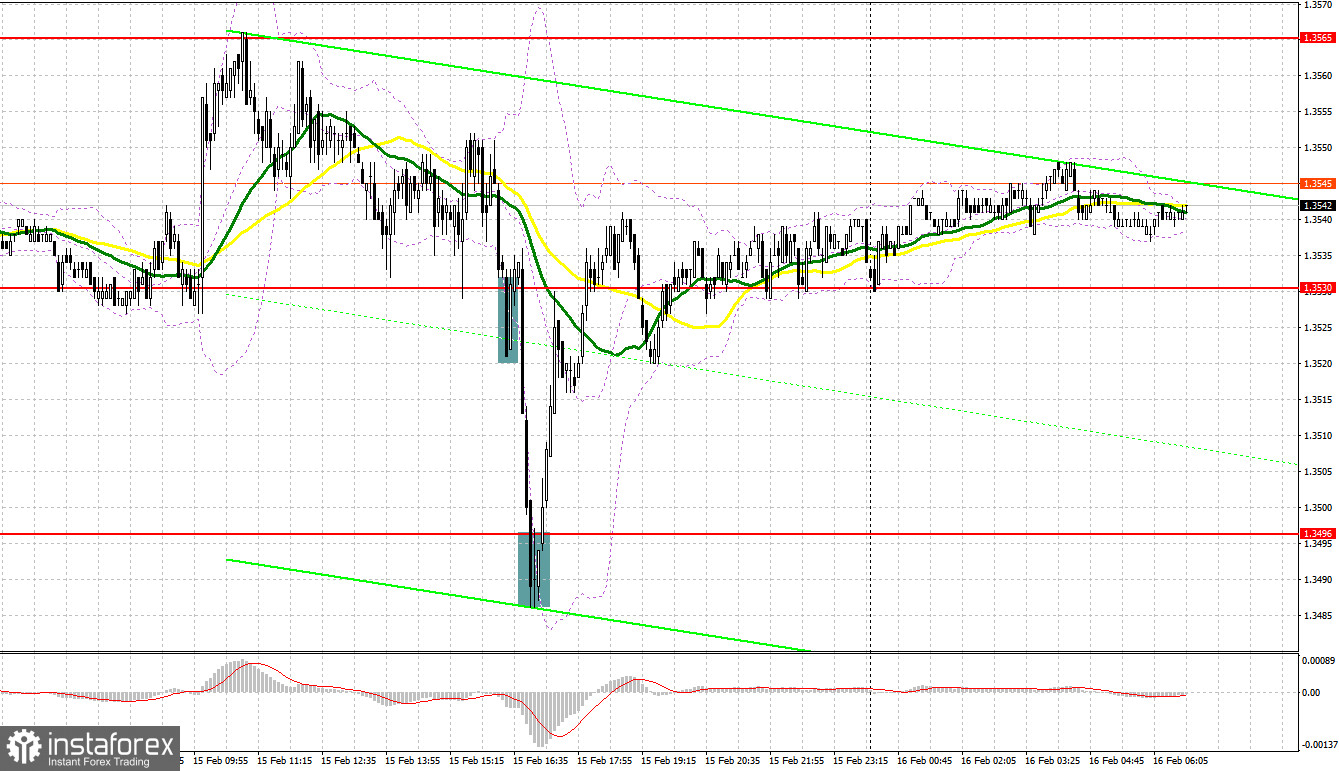
Yesterday, GBP/USD provided a few market entry points. Now let's look at the 5-minute chart and try to figure out what actually happened. In my yesterday's forecast, I turned your attention to 1.3570 and recommended taking decisions with this level in focus. Important economic data from UK played its role, causing GBP growth in the first half of the day. The data on the labor market matched the consensus and did not indicate a negative impact of some headwinds on the labor market. However, the price missed just 5 pips to print a higher high from 1.3570. So, the pair didn't make a false breakout and I didn't find a good entry point with short positions. In the second half of the day, the technical picture changed and I watched the buyers' behavior at 1.3530. A fake breakout of this level was an excuse for buying. Nevertheless, strong US PPI data pushed the pair down that triggered stop loss orders. A fall led to another false breakout at about 1.3496 where GBP/USD gave another good signal to open long positions. The price grew more than 40 pips from this level.

The bulls are actively protecting 1.35. The market sees that traders are accumulating big positions in that area. It proves that large market players are betting on GBP strength, expecting its rise to one-month highs. Today the UK is due to report on its consumer and factory inflation (CPI and PPI). If inflation doesn't ease its rampant growth in January (at least it is expected by economists), demand for GBP will revive for sure.
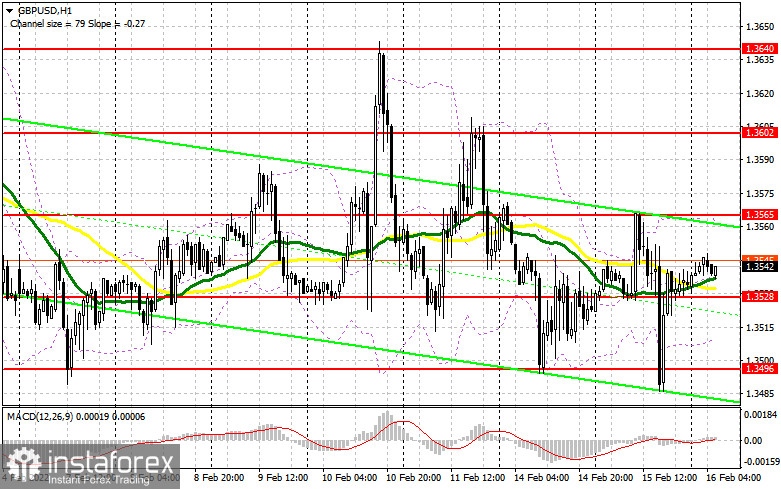
The main task for the bulls in the first half of the day is to defend support at 1.3528 formed yesterday and to regain control over new resistance at 1.3565. Earlier, the price failed to break through it. We could plan long positions from 1.3528 only in case of a false breakout. The fundamental data on the UK CPI and PPI is sure to trigger a new bullish wave up to 1.3565. A breakout and test of this level downwards will generate an extra signal to buy towards 1.3602. A more distant target is seen at 1.3640 where I recommend profit taking. Alternatively, if GBP/USD declines during the European session and the bulls lack activity at 1.3528, it would be better not to rush to buy risky assets. By the way, moving averages are passing through 1.3528, benefiting the bulls. I would recommend waiting until the next major level of 1.3496 is tested where the lower border of the trend channel is passing. Only a false breakout like I described above will generate a market entry point with long positions. We could buy GBP immediately at a drop off 1.3465 or lower from 1.3434, bearing in mind a 20-25 pips intraday correction.
What is needed to open short positions on GBP/USD
Meanwhile, the bears are reluctant to assert themselves. Nevertheless, a successful price action at about resistance of 1.3565 could put the currency pair under selling pressure. I would advise you to focus on this level during the publication of the UK inflation data. Defending this level is the key issue for the bears. They should not allow GBP to go higher because all bearish efforts would be in vain and the currency pair might get trapped in a range. A false breakout at 1.3565 would create an excellent entry point with short position. In this case, we could reckon that the downtrend could resume and the price would decline to 1.3528. A breakout and test of this level upwards will create an extra entry point with short positions with downward targets at 1.3496 and 1.3465. A deeper target is seen at 1.3434 where I recommend profit taking. In case GBP/USD grows during the European session and the bears lack activity at 1.3565, it would be better to cancel selling until 1.3602. It would be nice to open short positions there immediately at a bounce off 1.3640, bearing in mind a 20-25 pips intraday drop.

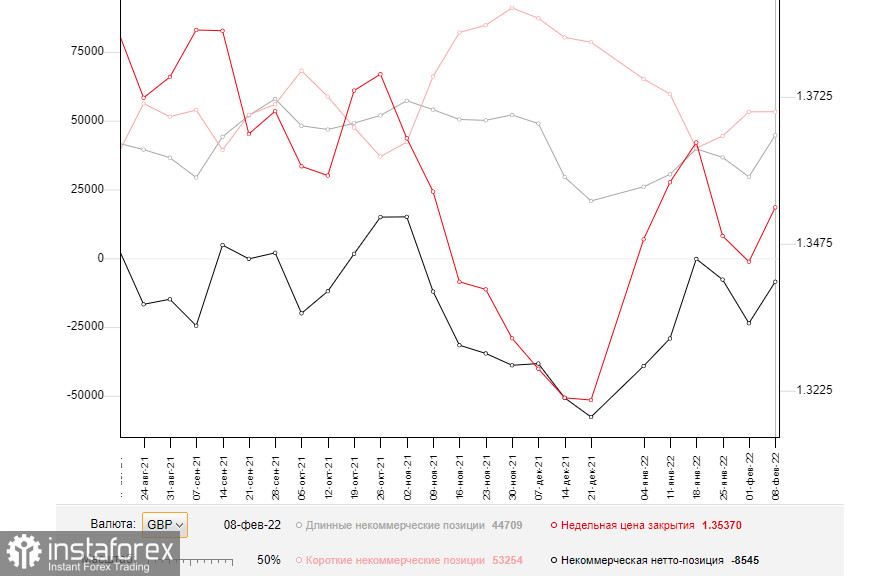
The COT (Commitment of Traders) report from February 8 logs a sharp increase in both short and long positions. Buying was more vigorous that contracted the negative delta. However, the negative value was still valid. It means that the market is still in the grips of the bears. This COT report takes into account the Bank of England's policy decisions, including a rate hike. Despite this fact, GBP didn't find any help. Everybody is aware that the Bank of England ventured into monetary tightening in an effort to fight against soaring inflation. The British economic is going through rough times nowadays. The economic growth might stall anytime soon. That's why raising interest rates didn't fuel a rally in GBP. Geopolitical tensions between Russia and Ukraine and the Federal Reserve's hawkish rhetoric that implies the first rate hike in March dampen global risk sentiment. So, the bulls are cautious about buying GBP/USD. Some market participants expect the US central bank to raise the funds rate by 0.5% at a time, not by 0.25%. If so, such aggressive tightening will set the stage for a rapid advance of the US dollar.
According to the COT report from February 8, long non-commercial positions rose sharply from 29,597 to 44,709 whereas short non-commercial positions grew moderately from 53,202 to 53,254. This contracted abruptly the negative non-commercial net positions from -23,605 to -8,545. GBP/USD closed last week higher at 1.3537 from 1.3444 a week ago.

Indicators' signals:
Trading is carried out above the 30 and 50 daily moving averages. It indicates that the bulls are determined to push GBP/USD higher.
Moving averages
Note: The period and prices of moving averages are considered by the author on the H1 hourly chart and differs from the general definition of the classic daily moving averages on the daily D1 chart.
Bollinger Bands
If GBP/USD declines, the lower border of 1.3505 will serve as support.
Description of indicators
- Moving average (moving average, determines the current trend by smoothing out volatility and noise). Period 50. It is marked yellow on the chart.
- Moving average (moving average, determines the current trend by smoothing out volatility and noise). Period 30. It is marked green on the chart.
- MACD indicator (Moving Average Convergence/Divergence — convergence/divergence of moving averages) Quick EMA period 12. Slow EMA period to 26. SMA period 9
- Bollinger Bands (Bollinger Bands). Period 20
- Non-commercial speculative traders, such as individual traders, hedge funds, and large institutions that use the futures market for speculative purposes and meet certain requirements.
- Long non-commercial positions represent the total long open position of non-commercial traders.
- Short non-commercial positions represent the total short open position of non-commercial traders.
- Total non-commercial net position is the difference between short and long positions of non-commercial traders.


