


Analysis of Thursday's trades:
GBP/USD 30M Chart
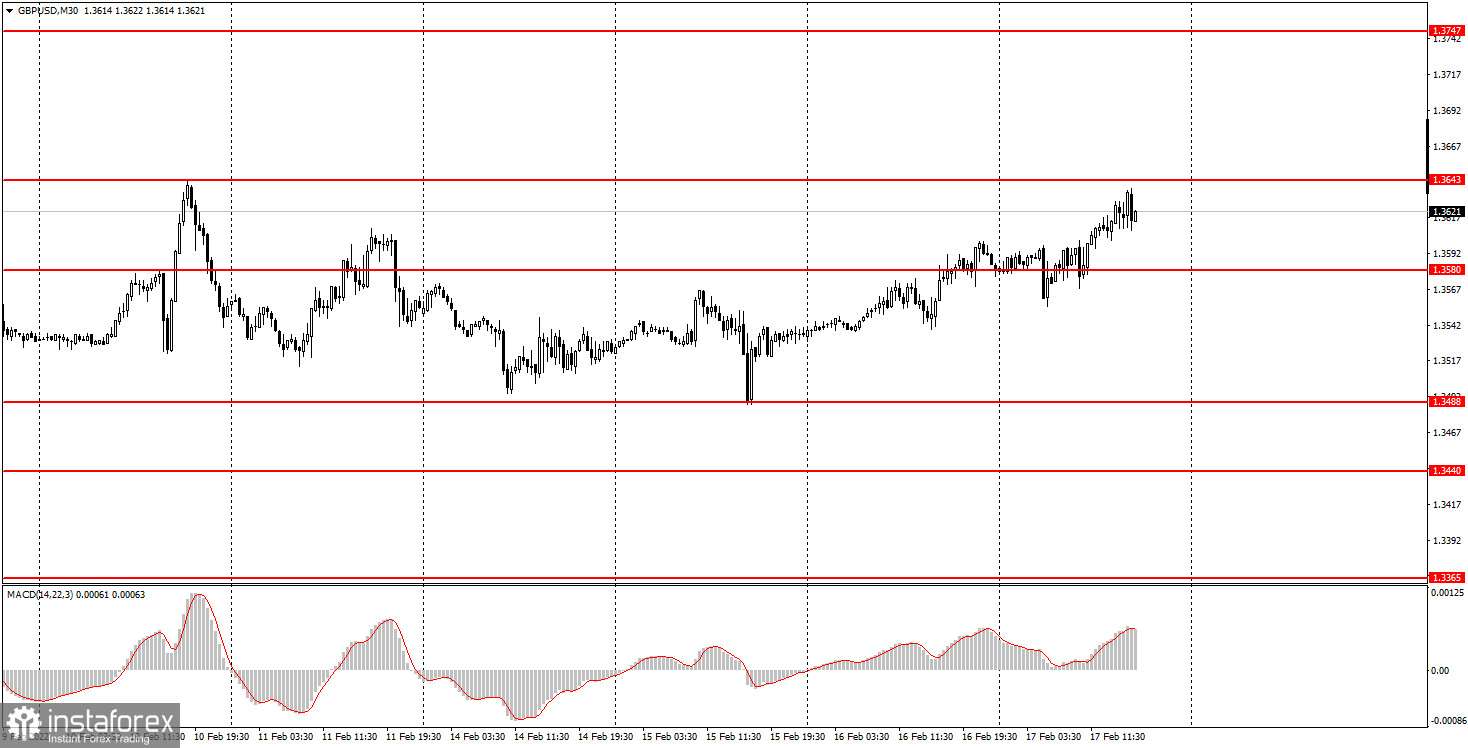
On Thursday, February 17th, the GBP/USD continued rising after breaking the level of 1.3580. However, the pair's movement was of little interest to traders. First, it was weak again. The intraday volatility was about 80 pips but half of this activity was seen during overnight trades. Second, the cable printed an unexpected plunge three times a day. And finally, there were no important publications apart from geopolitical news. Admittedly, the geopolitics deteriorated. Even the level of 1.3580, which used to be rather effective, was ignored on Thursday. Overall, GBP/USD has been stuck between 1.3488 and 1.3643 for 12 trading days already. This wide sideways channel makes it difficult to conduct analysis and open trades. If the channel were narrow, we could have traded a rebound from its boundaries. Instead, we have to watch the price moving from one boundary to another for several days without even touching them.
GBP/USD 5M Chart
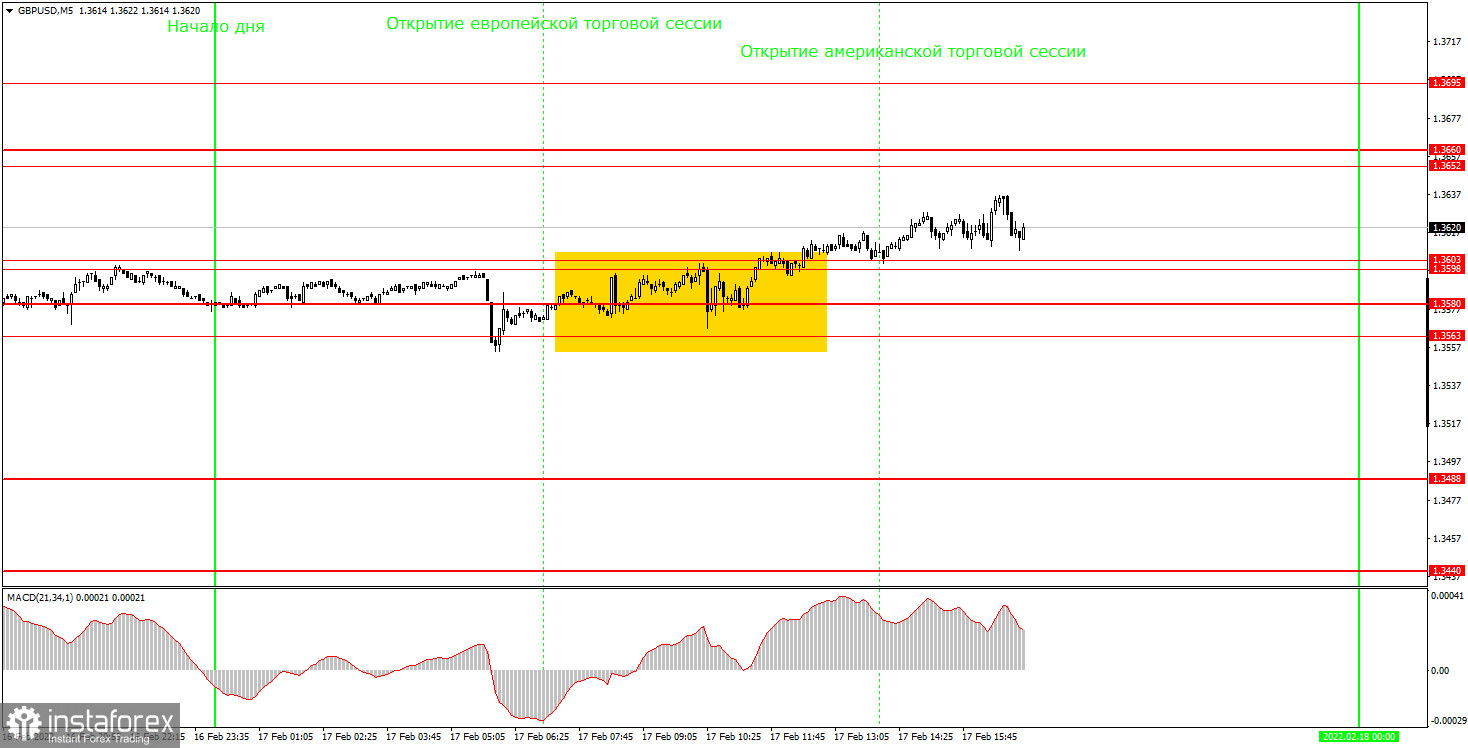
In the 5M time frame, the technical picture looks awful. It can be clearly seen that the trend was flat for most of the day. Only in afternoon trades, the pair made an attempt to resume the uptrend. During the European session, the cable rested on 1.3563, 1.3580, 1.3598, and 1.3603. Though the distance between them is 40 pips, these levels are considered a resistance area. Should traders try to find a signal in this area, they were surprised to see that the price almost reached the next level. As a result, all they could do today was to go long after a break of 1.3603. But in this case, it was rather difficult to get some profits. First, the buy signal was very weak. Second, the price went mere 25 pips after the formation of this signal. It was enough to set a Stop Loss at a breakeven point where the trade was most probably closed. On the plus side, we did not incur any losses today as the rate has been barely moving over the past two weeks.
Trading plan for Friday, February 18th:
In the 30M time frame, the upward trend became invalid but it was not replaced by a downward trend. The cable has been stuck between 1.3488 and 1.3643 for the past 12 days. So, there is simply no definite trend. We cannot predict when this tendency will end. The target levels in the 5M time frame can be found at 1.3488, 1.3563-1.3580, 1.3598-1.3603, 1.3652-1.3660, and 1.3695. After the price breaks Set a Stop loss at a breakeven point if the rate goes 20 pips in your direction after opening a trade. Tomorrow the United Kingdom will release the retail sales report for January. Hopefully, market participants will pay attention to this data at least. As long as the price is stuck in the sideways channel, it does not matter. The United States will not present any crucial reports. So, we can only expect the British stats to trigger some moves and hope that there will be no negative geopolitical news.
The basic principles of the trading system:
1) The strength of the signal depends on the time period during which the signal was formed (a rebound or a break)/ The shorter this period, the stronger the signal.
2) If two or more trades were opened at some level following false signals, i.e. those signals that did not lead the price to Take Profit level or the nearest target levels, then any consequent signals near this level should be ignored.
3) During the flat trend, any currency pair may form a lot of false signals or do not produce any signals at all. In any case, the flat trend is not the best condition for trading.
4) Trades are opened in the time period between the beginning of the European session and until the middle of the American one when all deals should be closed manually.
5) We can pay attention to the MACD signals in the 30M time frame only if there is good volatility and a definite trend confirmed by a trend line or a trend channel.
6) If two key levels are too close to each other (about 5-15 pips), then this is a support or resistance area.
What a chart can show us:
Support and Resistance price levels can serve as targets when buying or selling. You can place Take Profit levels near them.
Red lines are channels or trend lines that display the current trend and show which direction is better to trade.
MACD indicator (14,22,3) is a histogram and a signal line showing when it is better to enter the market when they cross. This indicator is better to be used in combination with trend channels or trend lines.
Important speeches and reports that are always reflected in the economic calendars can greatly influence the movement of a currency pair. Therefore, during such events, it is recommended to trade as carefully as possible or exit the market in order to avoid a sharp price reversal against the previous movement.
Beginning traders should remember that every trade cannot be profitable. The development of a reliable strategy and money management are the key to success in trading over a long period of time.


