


Futures for major U.S. stocks are rising, and the dollar is falling on Monday amid hopes for a diplomatic settlement of the crisis in Ukraine.
U.S. President Joe Biden and Russian President Vladimir Putin have reached an agreement in principle to hold the summit. Its details will be discussed at a meeting between U.S. Secretary of State Antony Blinken and Russian Foreign Minister Sergey Lavrov on Thursday.
U.S. markets are closed today for President's Day. More or less significant statistics will begin to appear on Tuesday, when at the beginning of the American trading session the PMI Markit indices on activity in the manufacturing and services sectors of the American economy will be published.
However, the most important macro statistics for the U.S. will be released on Thursday, when the second estimate of annual GDP for the 4th quarter will be published at 13:30 (GMT). GDP data is one of the key data (along with data on the labor market and inflation) for the Fed in terms of its monetary policy. A strong result strengthens the U.S. dollar, while a weak report on GDP has a negative impact on the U.S. dollar. In the previous 3rd quarter, GDP grew by +2.3%, in the 2nd quarter - by +6.7%, and in the 1st quarter of 2021 by +6.3%.
If the data points to a decline in GDP in the 4th quarter, then the dollar will be under pressure. Positive data on GDP will support the dollar and U.S. stock indices. The first estimate was +6.9%. The second estimate assumes Q4 US GDP growth of +7.0%. This is a very positive indicator, which should support the dollar.
Meanwhile, some economists are predicting the Fed will raise interest rates 9 times in a row, bringing it to 2.50% by mid-2023.
"With today's strong economy and inflation that is well above our 2% longer-run goal, it is time to start the process of steadily moving the [Fed's benchmark interest-rate] target range back to more normal levels," New York Fed President John Williams said in a virtual speech on Friday. "I expect it will be appropriate to raise the target range at our upcoming meeting in March."
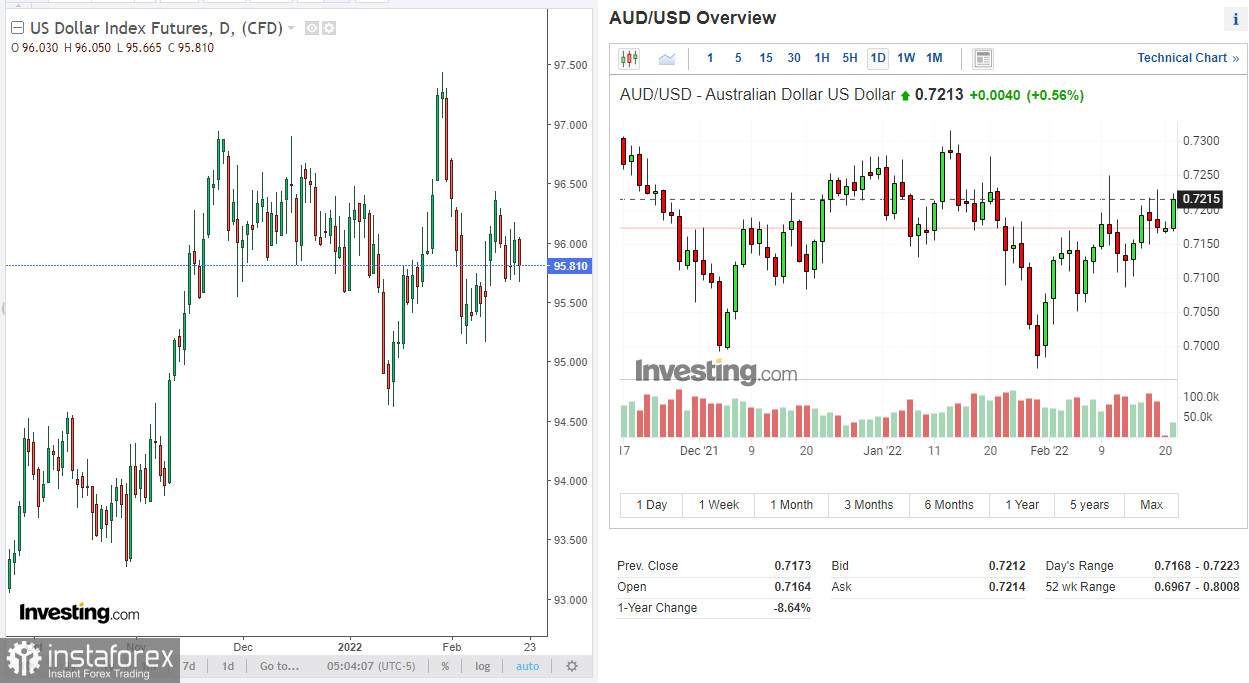
The Fed has also signaled that it will soon begin to reduce its balance sheet, which now stands at nearly $9 trillion. These are all positive factors for the U.S. dollar. But so far it has been declining, including against major commodity currencies. Thus, the pair AUD/USD reached an intraday high of 0.7220 today, meeting resistance at the upper border of the descending channel on the daily chart.
Meanwhile, the Australian dollar received support today from the positive macro statistics released at the beginning of today's trading day. The PMI index in the manufacturing sector from Commonwealth Bank in February rose from 55.1 to 57.6 (the forecast was 56.1). The index of business activity in the service sector from Commonwealth Bank for the same period strengthened from 46.6 to 56.4 (the forecast assumed a decrease to 42.6 points). There are not so many statistics for Australia this week. Therefore, in the dynamics of AUD/USD, one should focus primarily on the dynamics of the USD.
Technical analysis and trading recommendations
Since the beginning of this month, AUD/USD has been developing an upward correction, strengthening towards the key long-term resistance level of 0.7300 (200 EMA on the daily and weekly charts).
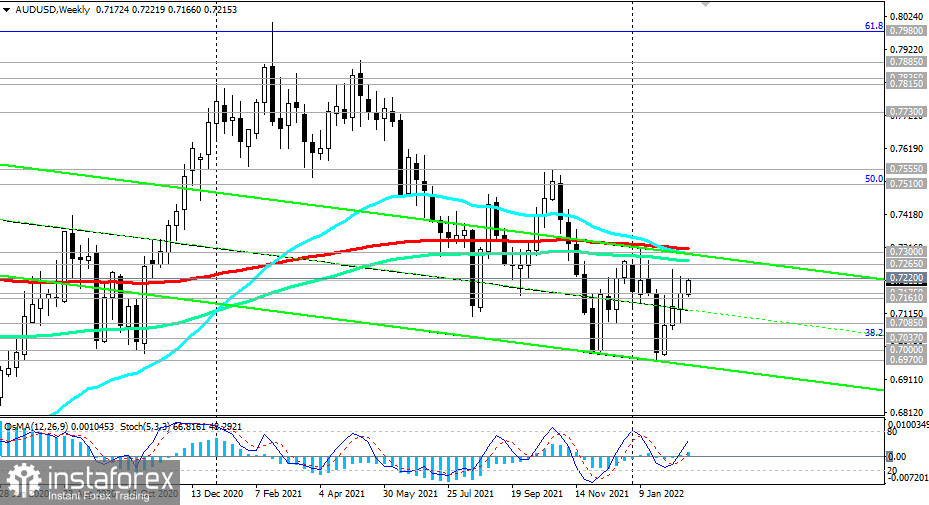
Below this resistance level, AUD/USD is in a bear market zone. An upward correction may yet send AUD/USD towards the long-term resistance level of 0.7265 (144 EMA on the daily chart) after breaking through the upper limit of the descending channel on the daily chart, passing through 0.7220. However, only a break of the resistance level of 0.7300 can again turn the tide and bring AUD/USD into the bull market zone.
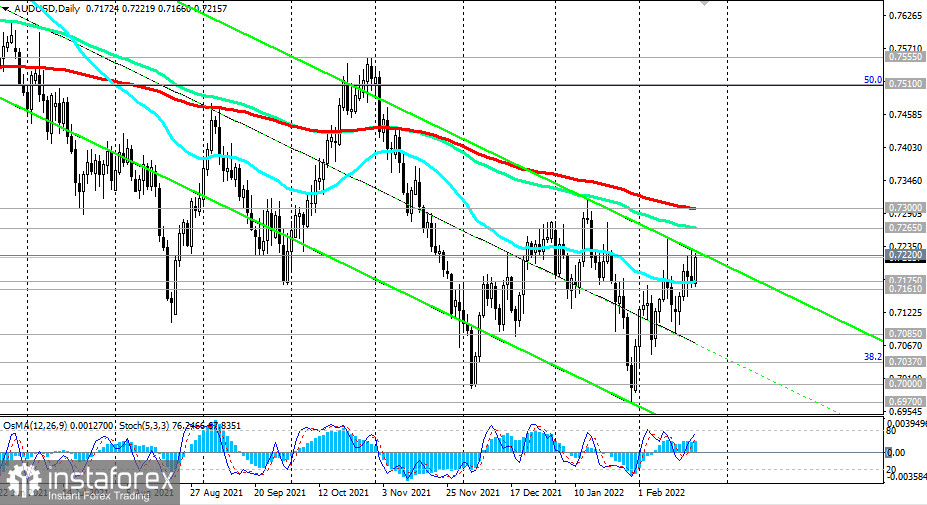
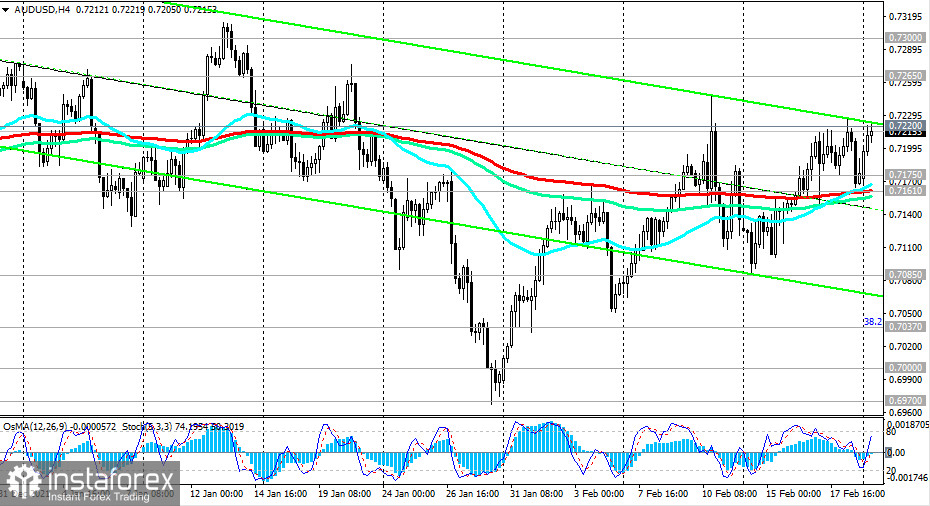
In the main scenario, we expect AUD/USD to resume its decline, and the signal for this will be a breakdown of support levels 0.7175 (50 EMA on the daily chart), 0.7161 (200 EMA on the 4-hour chart). As long as AUD/USD remains in the global bearish trend zone, short positions should be preferred.
In case of a break of the local support level of 0.7085, the pair is waiting for a further deeper decline inside the descending channel on the daily chart. Its lower limit is below 0.6800. In this case, intermediate targets will be the support levels of 0.7037 (38.2% Fibonacci retracement to the wave of the pair's decline from the level of 0.9500 in July 2014 to the lows of 2020 near the level of 0.5510), 0.7000, 0.6970 (the lower limit of the descending channel on the weekly chart).
Support levels: 0.7175, 0.7161, 0.7085, 0.7037, 0.7000, 0.6970, 0.6900, 0.6800, 0.6455
Resistance levels: 0.7220, 0.7265, 0.7300
Trading Recommendations
Sell Stop 0.7155. Stop-Loss 0.7235. Take-Profit 0.7100, 0.7085, 0.7037, 0.7000, 0.6970, 0.6900, 0.6800, 0.6455
Buy Stop 0.7235. Stop-Loss 0.7190. Take-Profit 0.7265, 0.7300


