Futures on European and U.S. stock indices fell sharply, while oil quotes rose sharply after Russian President Vladimir Putin recognized the independence of the Donetsk and Luhansk People's Republics on Monday.
Officials from the White House and the European Union have already been quick to condemn Moscow's actions, calling them "a blatant violation of international law." U.S. President Joe Biden announced the introduction of new sanctions against Russia, while hopes for a possible summit of the American and Russian leaders are finally fading.
Russia is the largest exporter of energy resources, and Ukraine is the largest transit country for gas to Europe. The escalation of tension in the region and the possibility of new sanctions against Russia, given the freezing of the Nord Stream 2 gas pipeline, could lead to an even greater increase in prices.
On Monday, April futures for Brent crude oil ended trading with an increase of 2%, showing the strongest one-day growth since February 14. Natural gas prices were trading with an increase of more than 8%.
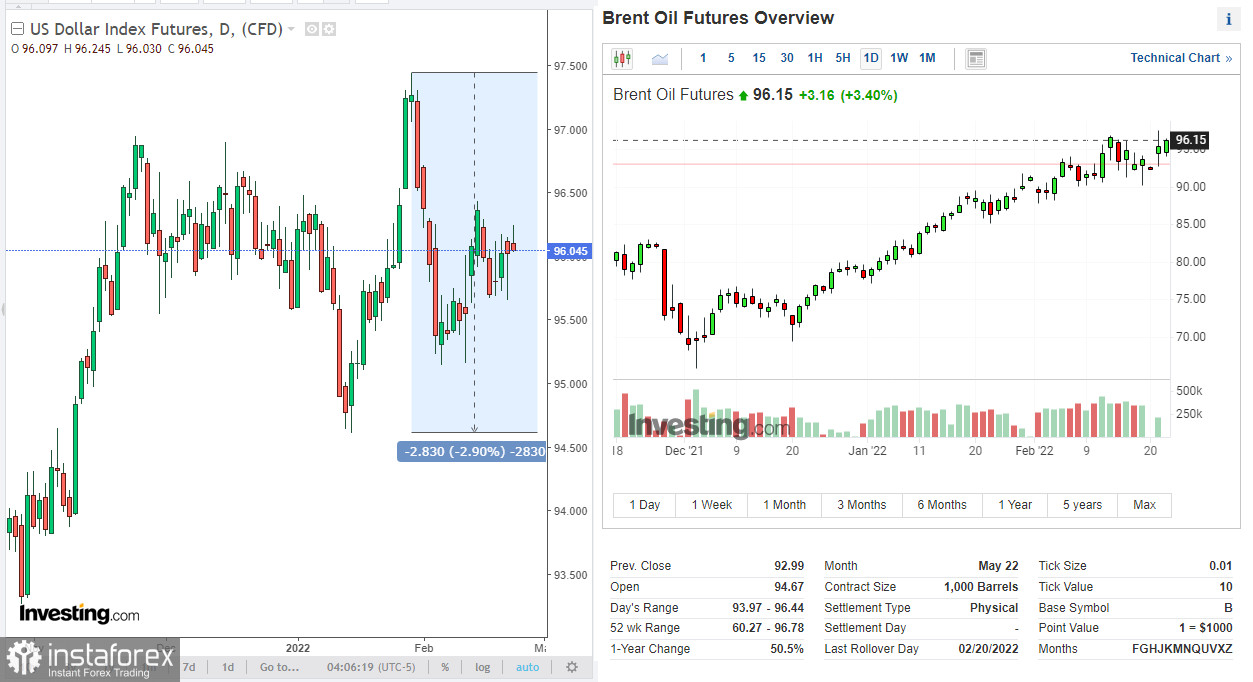
At the beginning of today's European session, Brent crude futures are trading near a multi-year high of $96.00 per barrel, while the DXY dollar index remains in the middle of the range between a local high of 97.44 and a low of 94.61.

Oil prices may also receive support after Saudi Arabia's statements that there are signs of an increase in demand, which continues to outpace supply against the backdrop of a rather conservative position of OPEC+.
On Monday, U.S. markets were closed for the celebration of Presidents' Day. The publication of important macro statistics is also shifted one day later. Thus, the weekly report of the Energy Information Administration of the U.S. Department of Energy on the weekly change in commercial stocks of oil and petroleum products will be published not on Wednesday, as usual, but on Thursday (at 16:00 GMT). The previous report showed an increase in inventories (by +1.121 million barrels) after a more significant fall 2 and 3 weeks earlier. If the data points to a decline in U.S. oil inventories, then this will give additional short-term impetus to oil prices.
In general, however, their upward momentum remains, and some oil market analysts warn that prices could exceed $100 a barrel if a war breaks out in Ukraine.
Of the news for today, market participants will pay attention to the publication in the period from 14:00 to 15:00 (GMT) of a block of important macro statistics for the U.S., among which are the PMI Markit indices for activity in the manufacturing and services sectors of the American economy.
An increase in indicators for February to 56.0 and 53.0, respectively, is expected. This is a positive factor for the dollar. In the event of supply disruptions, oil prices could pick up even if the dollar strengthens further.
Technical analysis and trading recommendations

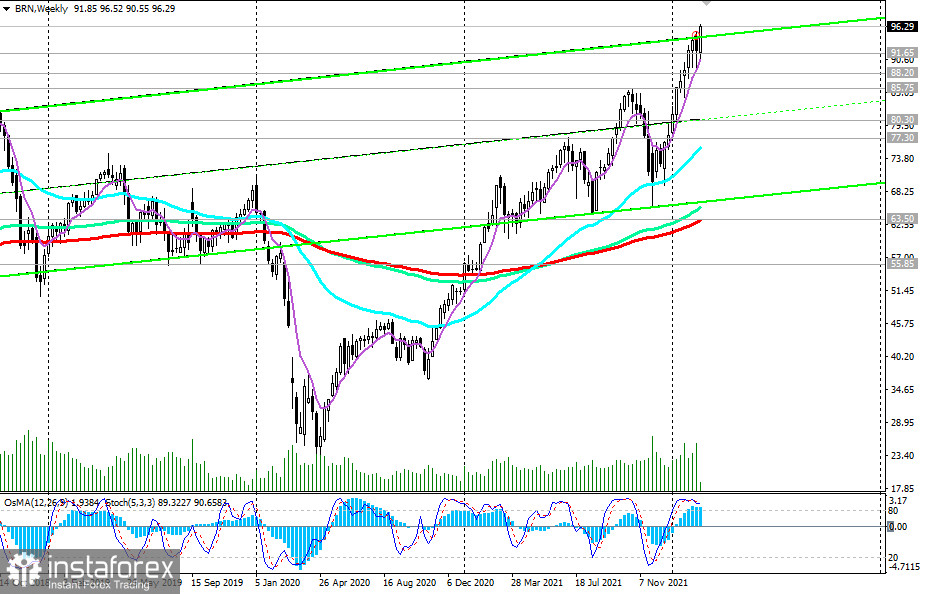
Oil prices have risen significantly over the past few weeks, staying in the bull market and trading above long-term support levels. At the time of writing, Brent oil futures are trading above 96.00, remaining in the zone of multi-year highs.

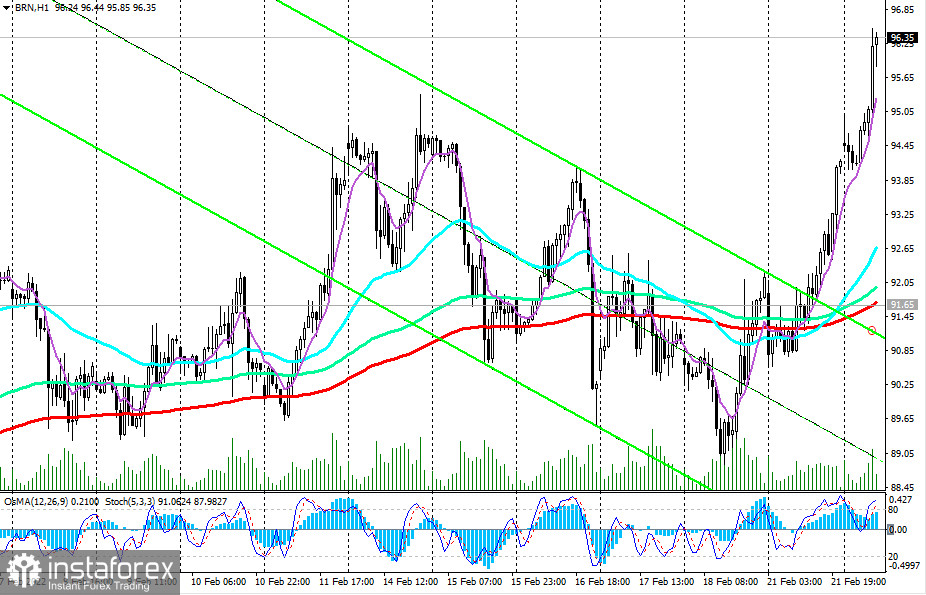
A breakdown of the local resistance level of 96.52 (today's high) will lead to further price growth, while oil market analysts predict that the positive dynamics of the oil market will continue against the backdrop of increased demand for energy and limited oil supplies by OPEC+ countries.

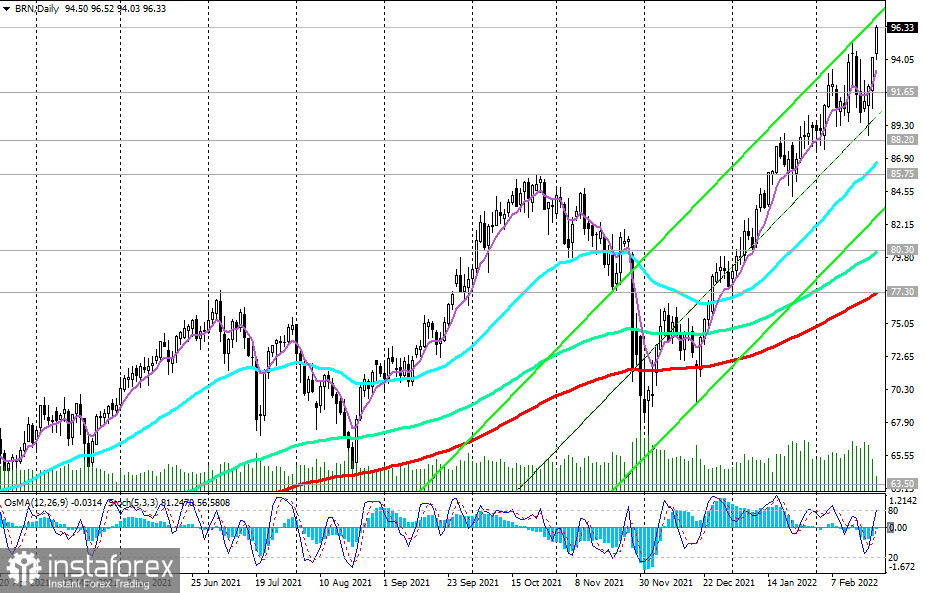
In an alternative scenario and in case of a breakdown of the support level 91.65 (200 EMA on the 1-hour chart), the price may fall first to the important support level 88.20 (200 EMA on the 4-hour chart), and then, after the breakdown of the local support level 85.75, to long-term support levels 80.30 (144 EMA on the daily chart), 77.30 (200 EMA on the daily chart). A breakdown of the key long-term support level 63.50 (200 EMA on the weekly chart) will increase the negative dynamics and the likelihood of a return to the long-term downward trend.
Support levels: 91.65, 88.20, 85.75, 80.30, 77.30, 63.50
Resistance levels: 96.52, 97.00, 98.00, 99.00, 100.00
Trading recommendations
Brent: Sell Stop 93.90 Stop-Loss 97.10. Take-Profit 91.65, 88.20, 85.75, 80.30, 77.30, 63.50
Buy Stop 97.10. Stop-Loss 93.90. Take-Profit 98.00, 99.00, 100.00


