


Trend analysis (Fig. 1)
GBP/USD will try to climb up on Wednesday, from 1.3581 (closing of yesterday's daily candle) to 1.3618, which is the historical resistance level (blue dotted line). After that it will move to the upper fractal at 1.3641 (red dotted line), then roll back downwards.
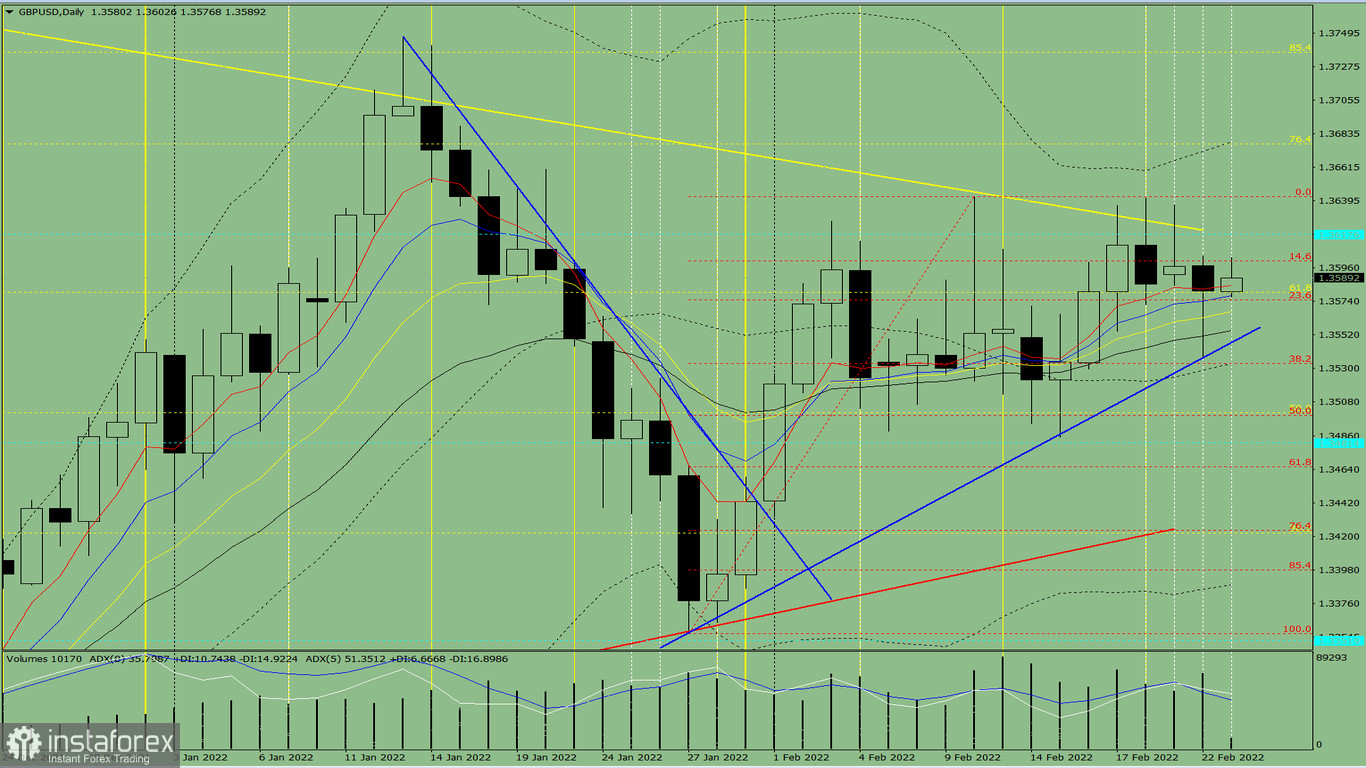
Fig. 1 (daily chart)
Comprehensive analysis:
Indicator analysis - uptrend
Fibonacci levels - uptrend
Volumes - uptrend
Candlestick analysis - uptrend
Trend analysis - uptrend
Bollinger bands - uptrend
Weekly chart - uptrend
Conclusion: GBP/USD will rally from 1.3581 (closing of yesterday's daily candle) to the historical resistance level at 1.3618 (blue dotted line), then go to 1.3641, which is the upper fractal (red dotted line). After that it will roll back downwards.
As such, it is unlikely that the pair will move down from 1.3581 (closing of yesterday's daily candle) to the support line at 1.3547 (thick blue line), then bounce up to the historical resistance level at 1.3618 (blue dotted line).


