


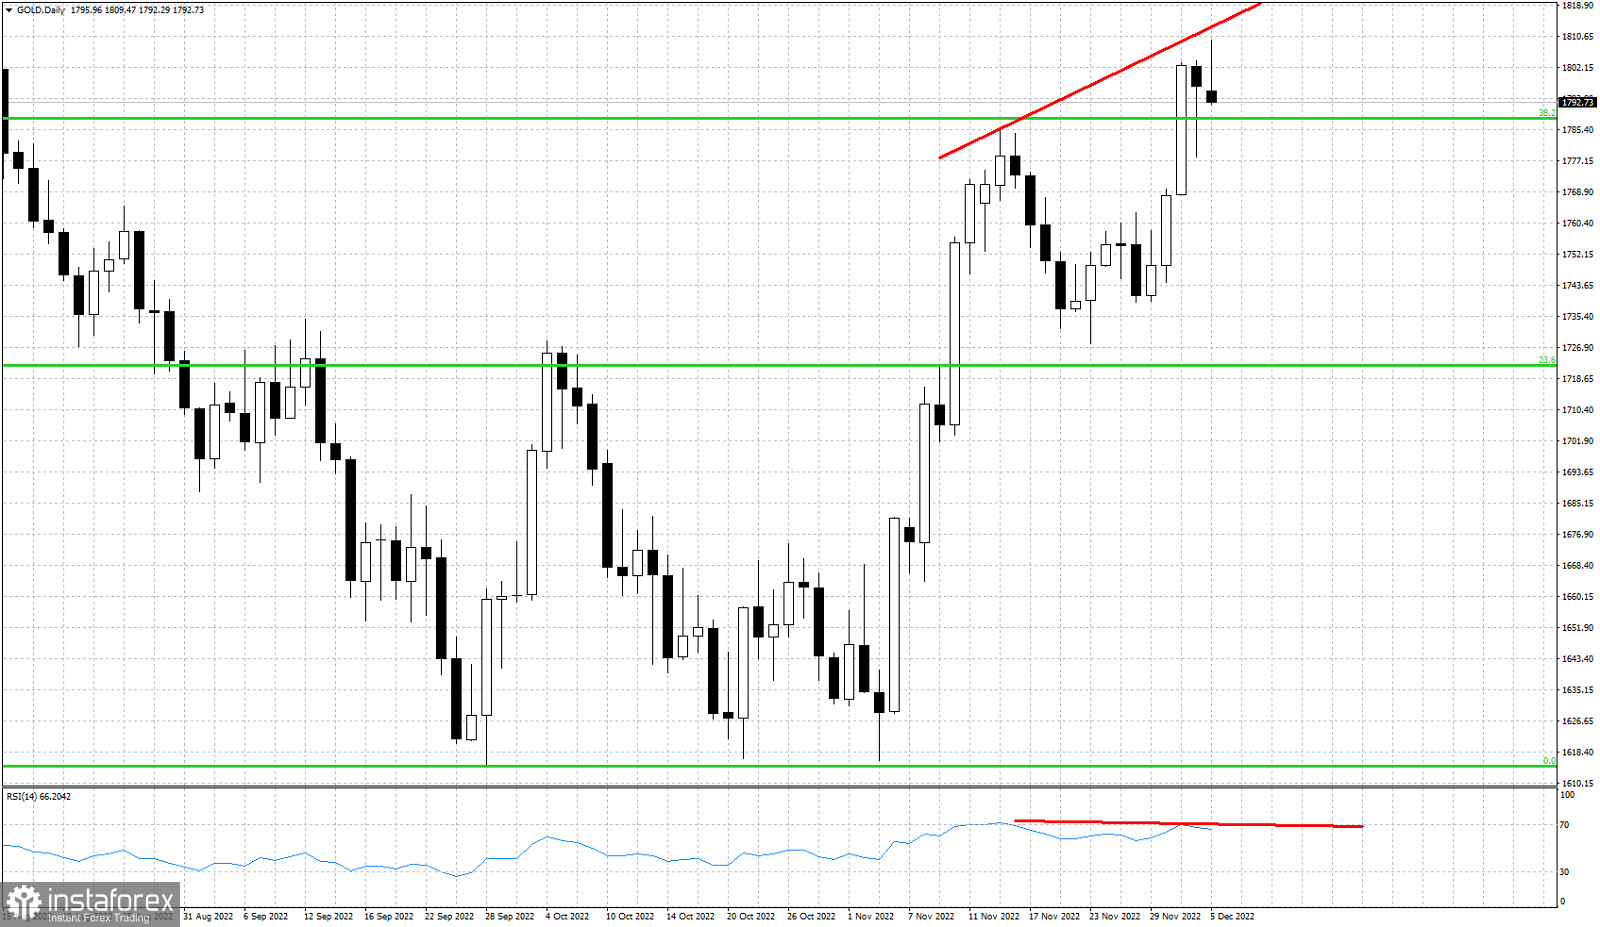
Red lines- bearish RSI divergence
Green lines- Fibonacci retracements
Gold price is trading around $1,790 despite making new higher highs earlier today above $1,805. Technically Gold price remains in a bullish short-term trend with potential to reach $1,840, but a daily candle with a long upper tail would be a bearish signal. Combining a bearish candlestick pattern with a bearish RSI divergence, increases the chances of a reversal. Gold has so far retraced a little bit more than the 38% of the entire decline from the $2,069 highs. Support is found at $1,775-77 where the previous high was and serves now as support. Next key short-term support level is at $1,730-35 where the higher low in November was created.


