


EUR/USD 5M
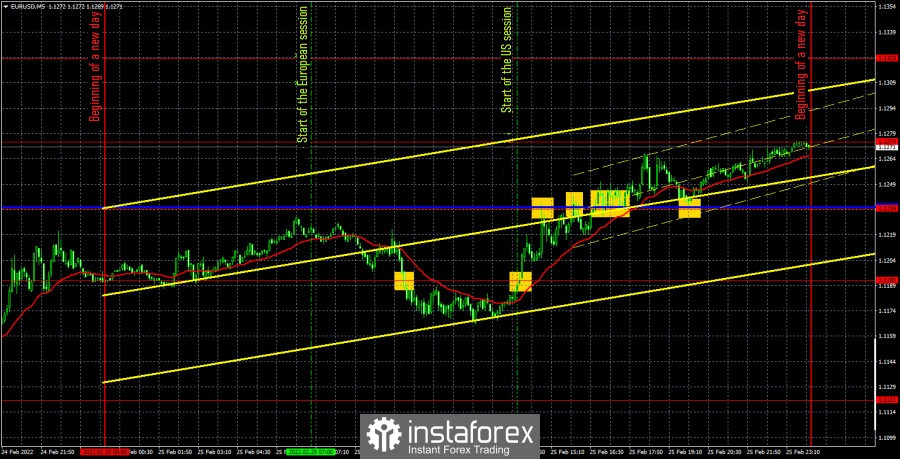
The EUR/USD pair increased by 80 points last Friday. Various movements were observed during the day, but still, for the most part, the pair was corrected after the fall on Thursday. Thus, at the moment the market is recovering after the collapse. Intraday movements are perfectly visible in the chart above, but they are not part of any trend on the higher timeframe. This is due to the fact that the movements at the end of last week were impulsive, emotional. In theory, now it is necessary for the market to completely calm down and move away from the events of last week and only after that to look for trends and determine the mood of the market. However, all events have a long-running essence. Simply put, they may have a continuation in the new week, which means that the market may not be at ease for a long time. Consequently, the movements can remain as confusing and unpredictable as possible. No important statistics were published on Friday either in the US or in the EU, and European Central Bank President Christine Lagarde's speech did not give any fundamentally new information.
As for trading signals, there were a lot of them on Friday. At first, the price settled below the level of 1.1192, which was a sell signal, but a false signal. The price was able to go down by only 15 points, which was at least enough to set the Stop Loss to breakeven. Therefore, this transaction closed at 0. The next buy signal was formed when the price settled above the level of 1.1192. The price was able to rise to the critical line, from which it bounced twice. At this point, traders could close long positions and open new shorts. However, the sell signal turned out to be false again, and the price managed to overcome the Kijun-sen line and continue to grow. As a result, it was possible to open two more long positions, the first of which closed at a Stop Loss of 0, and the second could bring a small profit.
COT report:
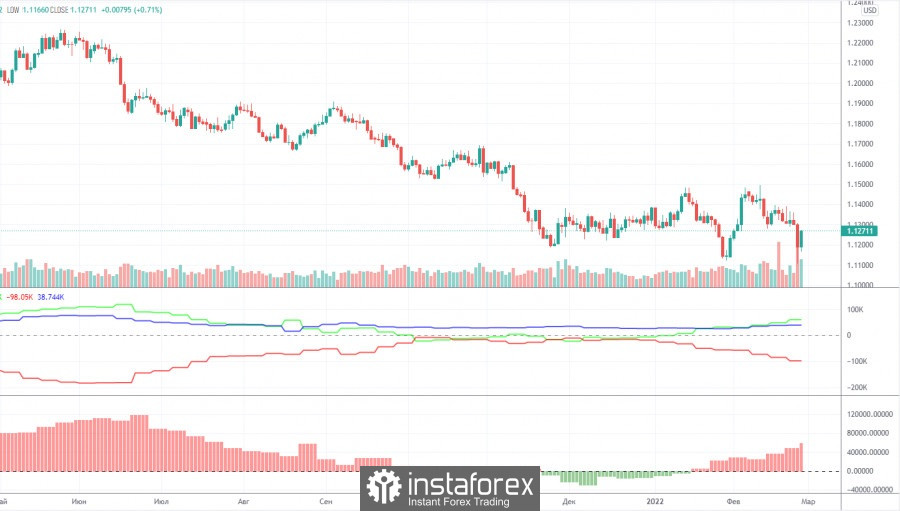
The new Commitment of Traders (COT) report, which was released on Friday, showed a new strengthening of the bullish mood among professional traders. This time, the "non-commercial" group closed about 17,000 contracts for short positions on euros and 5,500 long positions. Thus, the net position increased by 12,000, which is clearly visible on the second indicator in the chart above. The total number of long positions exceeds the number of short positions by 60,000, so now we can really say that a new upward trend is beginning to form. It would be possible to say, if not for one "but". The European currency is not growing. It does not rise even at a time when there seem to be "corrective" grounds for this. Recall that the euro currency has been getting cheaper in one way or another for 14 months. It does not grow even when the participants of the foreign exchange market themselves increase their long positions. It seems that geopolitics really remains in the foreground, so COT reports in some way lose their significance. Remember, when the Federal Reserve was actively pumping its economy with dollars, the data from the COT reports also did not always coincide with the trend in the market itself. This was because the money supply in the US was growing very fast, so it was not always important what actions the players in the market were taking. The "Fed factor" was more important. And now the factor of geopolitics is more important.
We recommend that you familiarize yourself with:
Overview of the EUR/USD pair. February 28. US Nonfarm and European inflation.
Overview of the GBP/USD pair. February 28. Silence in the UK. Smooth preparation for the meetings of the Bank of England and the Fed.
Forecast and trading signals for GBP/USD on February 28. Detailed analysis of the movement of the pair and trading transactions.
EUR/USD 1H
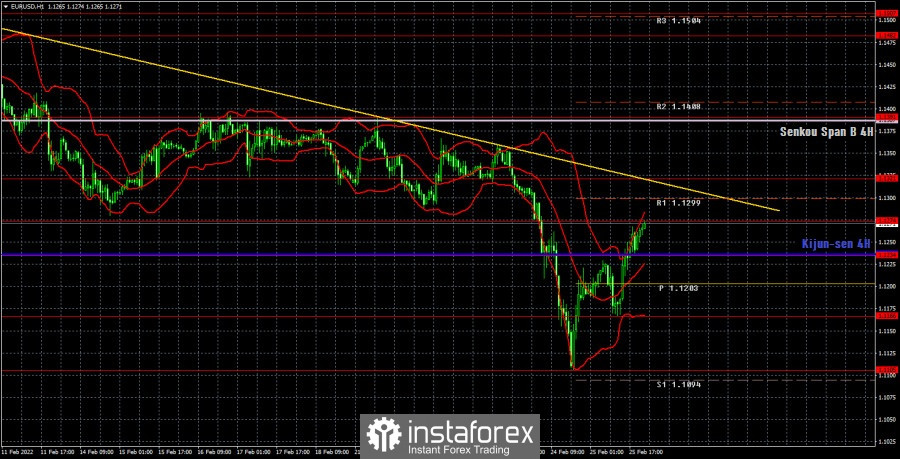
There is still a trend on the hourly timeframe. Although, as we said earlier, the fall at the end of last week breaks the technical picture, even corresponding to the downward trend. At this time, the pair is being adjusted to the trend line. A rebound from it may provoke a new fall in the European currency. A breakthrough - will break the downward trend. On Monday, we allocate the following levels for trading – 1.0990, 1.1105, 1.1166, 1.1234, 1.1274, 1.1321, 1.1391, as well as the Senkou Span B (1.1387) and Kijun-sen (1,1235) lines. There are also support and resistance levels, but signals will not be formed near them. The lines of the Ichimoku indicator may change their position during the day, which should be taken into account when searching for trading signals. Signals can be "bounces" and "breakthrough" levels - extremes and lines. Do not forget about placing a Stop Loss order at breakeven if the price went in the right direction of 15 points. This will protect you against possible losses if the signal turns out to be false. No important events or reports planned in the European Union and the United States on February 28. Thus, during the day, traders will have nothing to react to, and geopolitics will remain in the first place.
Explanations for the chart:
Support and Resistance Levels are the levels that serve as targets when buying or selling the pair. You can place Take Profit near these levels.
Kijun-sen and Senkou Span B lines are lines of the Ichimoku indicator transferred to the hourly timeframe from the 4-hour one.
Support and resistance areas are areas from which the price has repeatedly rebounded off.
Yellow lines are trend lines, trend channels and any other technical patterns.
Indicator 1 on the COT charts is the size of the net position of each category of traders.
Indicator 2 on the COT charts is the size of the net position for the non-commercial group.


