EUR/USD

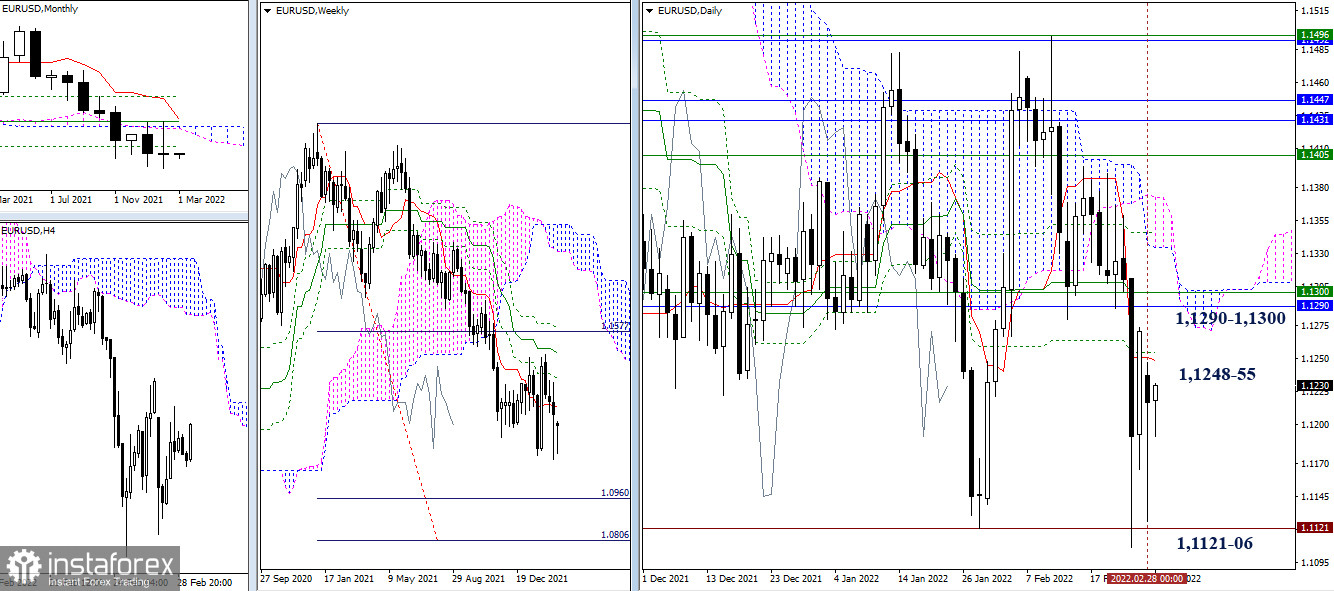
On the last day of February, bears failed to maintain momentum. EUR/USD is holding near the support level of 1.1121 (the previous lowest extremum point). This level may soon become a pivot point from which a full-fledged rebound may start. There is no clear result at the moment. The nearest upward targets are the daily levels at 1.1248 – 1.1255 and 1.1290 – 1.1300. The latter zone corresponds to the weekly short-term trend and the end of the monthly cross pattern. The situation will get more favorable for bears as soon as the price settles firmly below the lows of 1.1121-06. Next, the price may move down to break through the weekly Ichimoku cloud at 1.0960 – 1.0806.

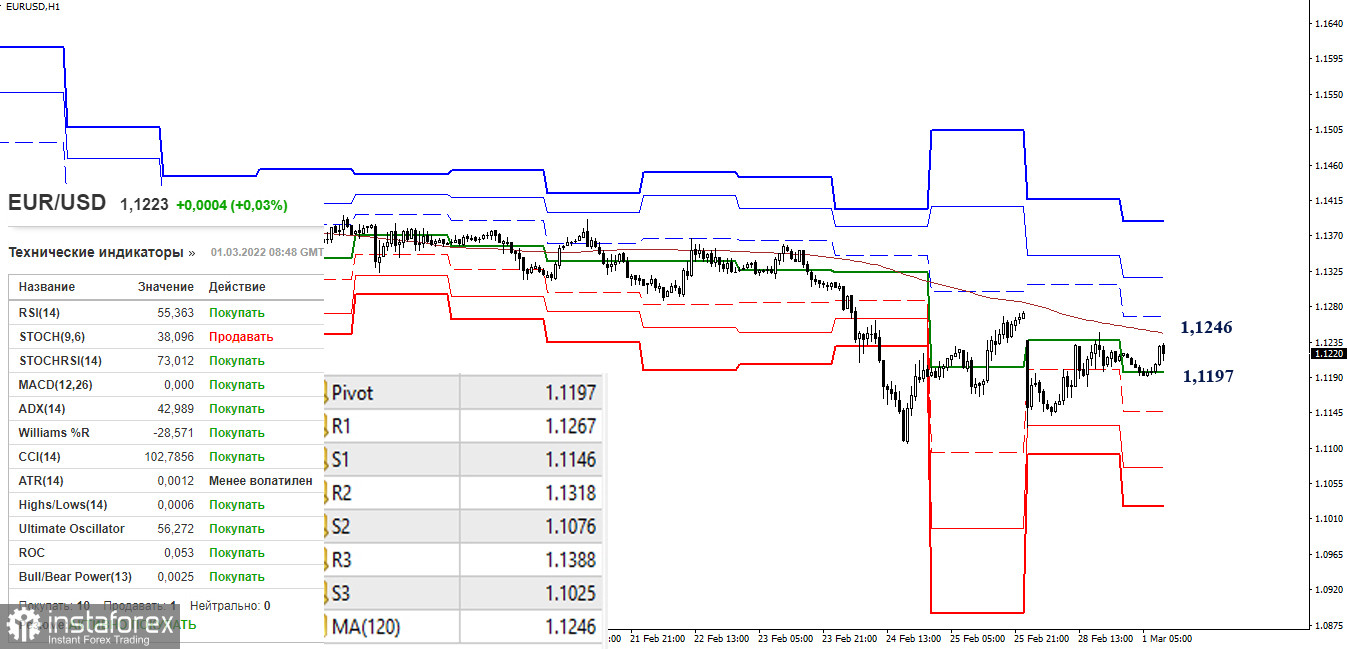
On lower time frames, the pair is still going through a correction. Bulls managed to conquer the first obstacle - the pivot level of 1.1197. Their next goal is to overcome and reverse the moving average which represents the weekly long-term trend at 1.1246. The resistance at the pivot levels of 1.1264 – 1.1318 – 1.1388 will serve as the next target. Bears should pay attention to intraday pivot points of 1.1146 – 1.1076 – 1.1025.
GBP/USD

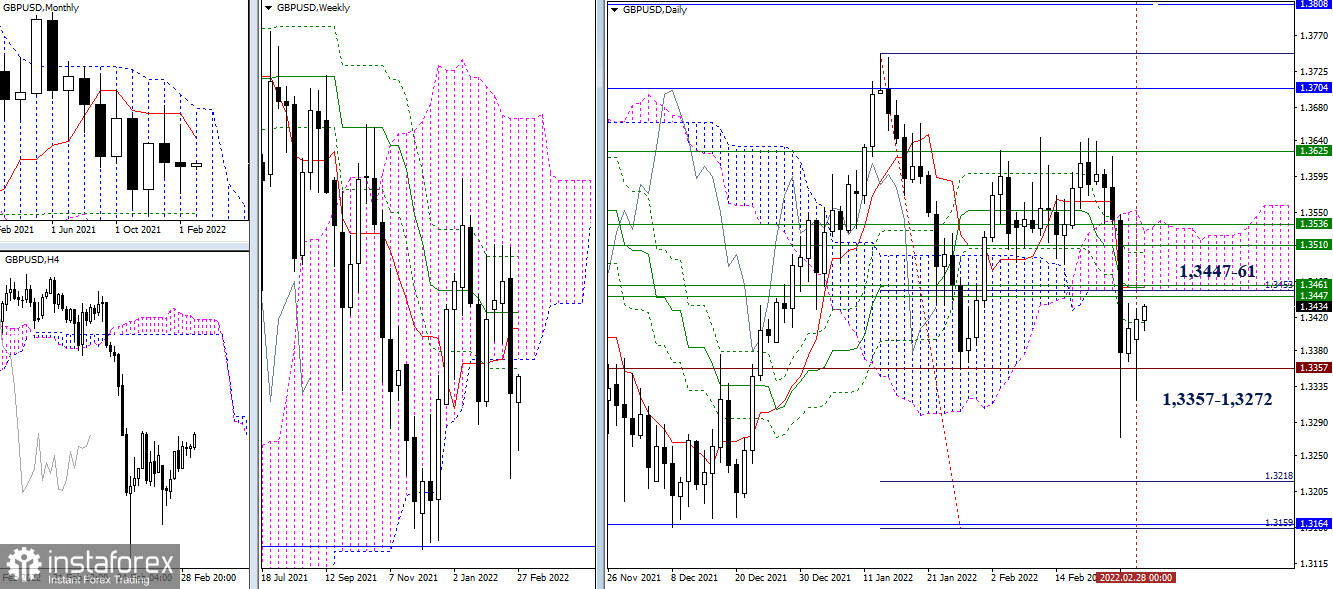
In February, no clear downtrend was observed on the pair. GBP/USD keeps consolidating near the previous low of 1.3357. Buyers will be able to assert their strength only after breaking through the resistance levels of 1.3447-61 (weekly levels + daily cross and lower boundary of the Ichimoku cloud) and 1.3510-36 (weekly + daily levels). As for bears, the downward breakout of the lowest levels at 1.3357 – 1.3272 will pave the way towards the support zones at 1.3218 – 1.3164 – 1.3159 which correspond to the monthly Fibo levels, Kijun lines, and the daily target for Ichimoku breakout.

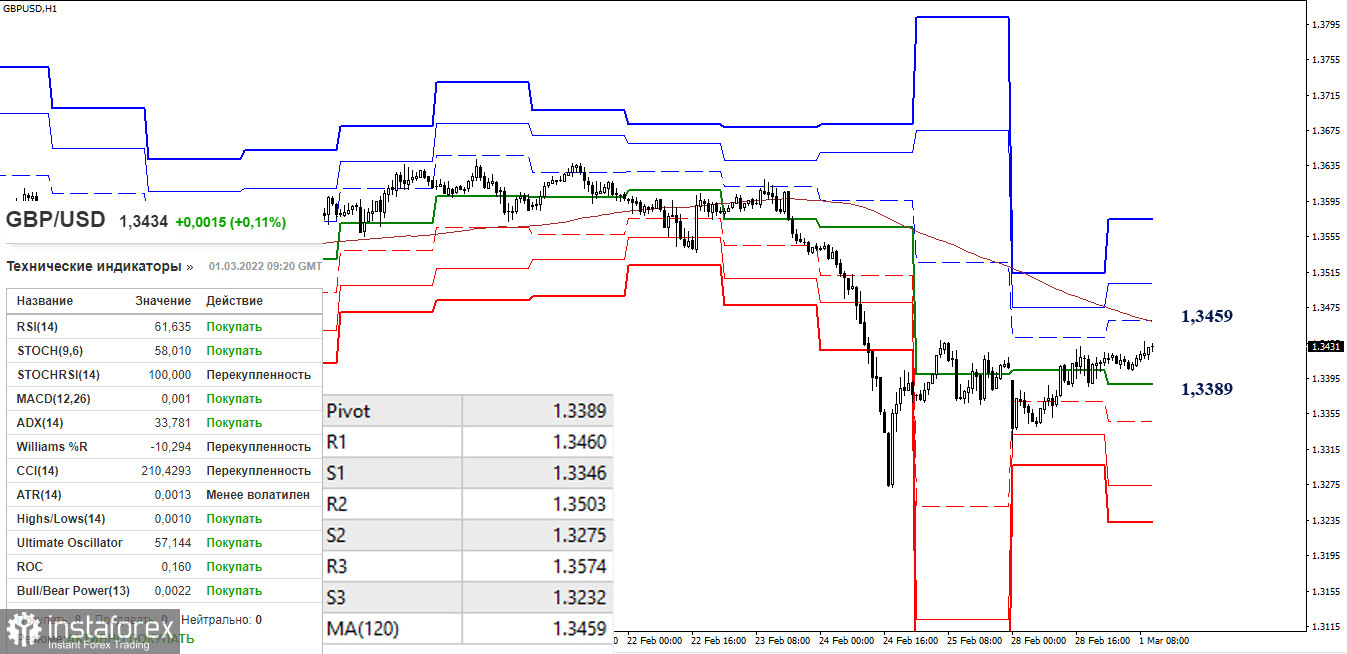
Meanwhile, bulls continue to develop an upward correction. After hitting the middle pivot level located at 1.3389, the price moved to the main target of the weekly long-term trend at 1.3459. A breakout, consolidation, and a reversal of the moving average may change the current balance in the market. The next targets on the intraday chart will become the levels of 1.3503 and 1.3574 (resistance of the classic pivot points). The downward targets for bears are found at 1.3389 – 1.3346 – 1.3275 – 1.3232 (the classic pivot points).
***
For technical analysis we use:
On higher time frames: Ichimoku Kinko Hyo (9.26.52) + Fibo and Kijun levels
On H1 chart: Classic Pivot Points + 120-day Moving Average (for weekly long-term trend)


