


Analysis of Tuesday's trades:
30M chart of EUR/USD
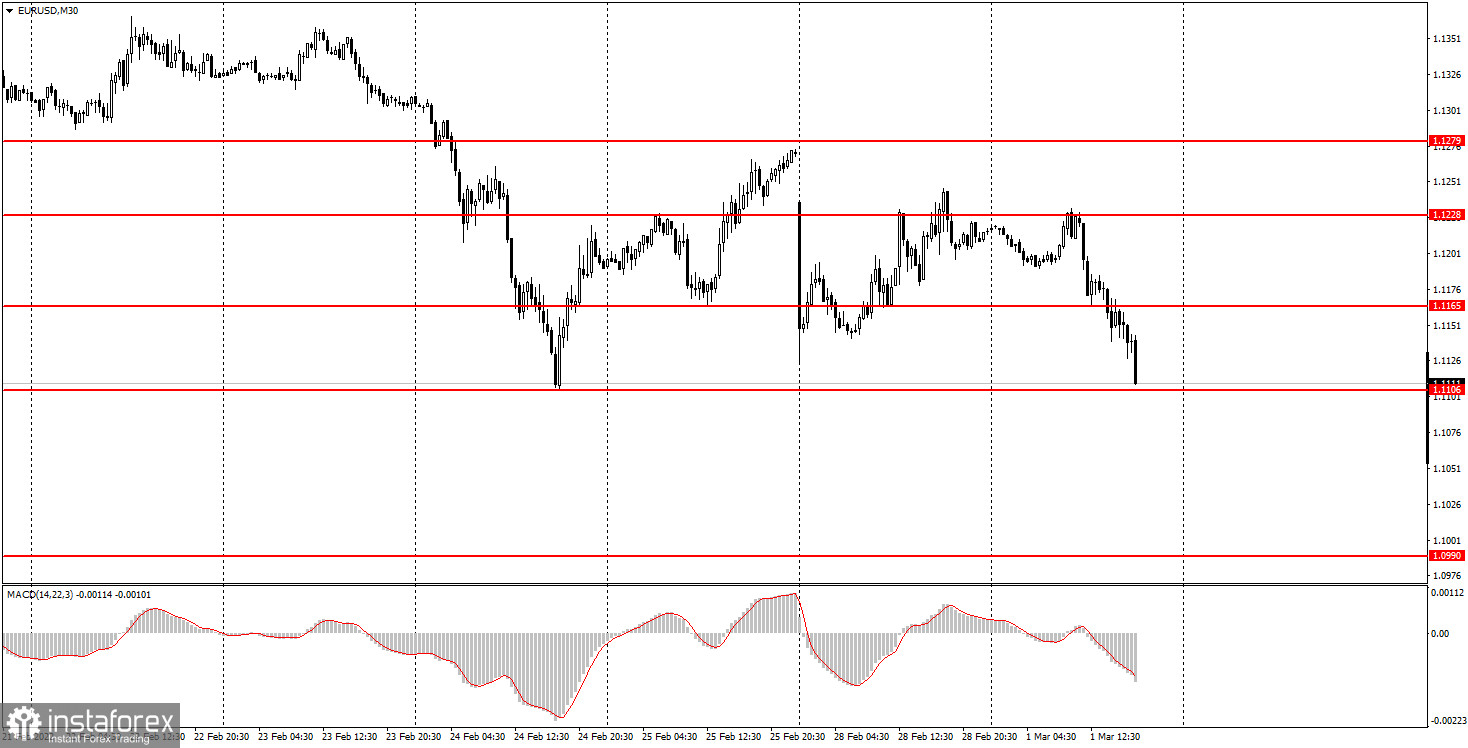
Technically, the euro/dollar pair traded very well on Tuesday. The quote attempted to extend the corrective move again to recoup losses of the previous week. However, the attempt failed and the price bounced off 1.1228. The trend is bearish although there is neither a clear trend line nor a channel. The euro is now feeling pressure versus the US dollar because it is a riskier asset than the latter. Therefore, the euro is highly likely to continue its bear run. The manufacturing business activity report came in the eurozone on Tuesday. Amid rising geopolitical tensions, the market showed no reaction to the data.
M5 chart of EUR/USD
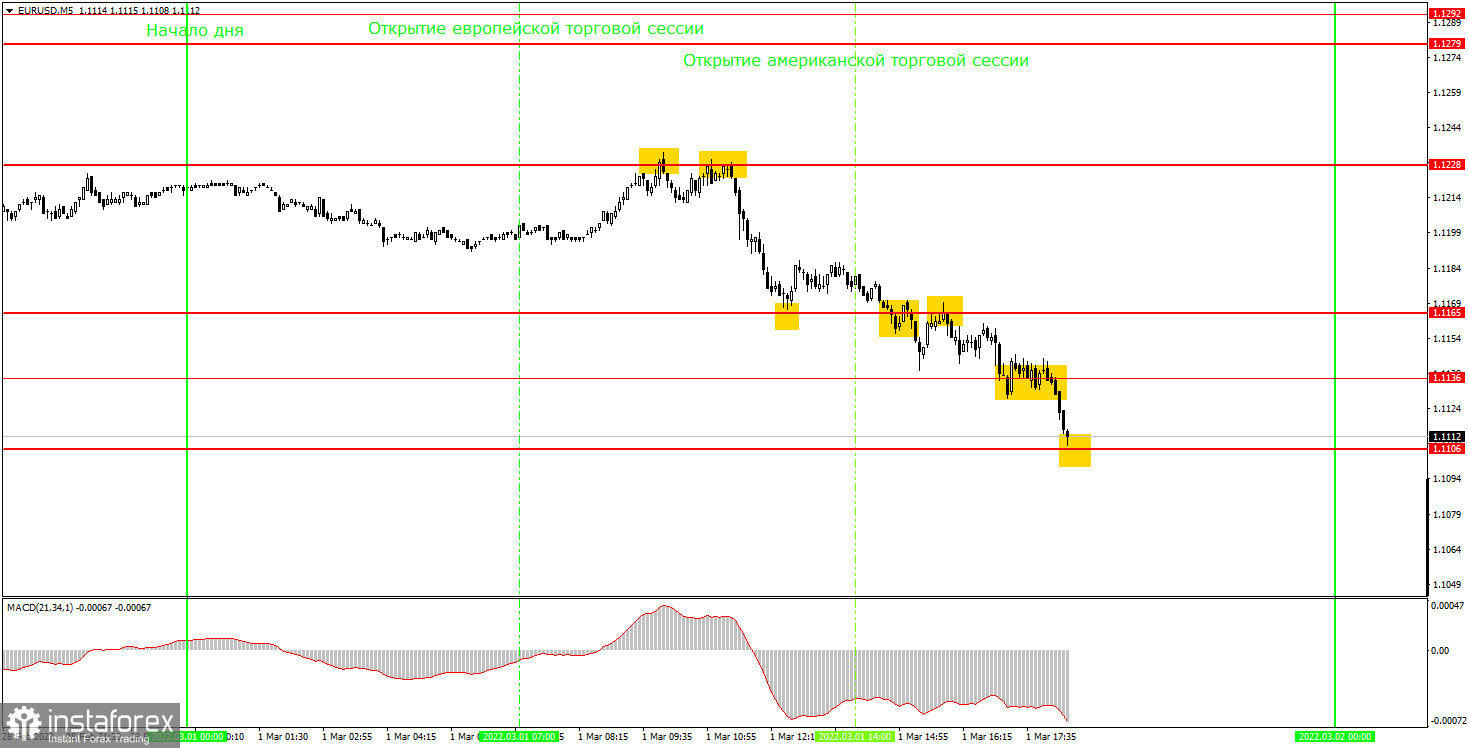
In the M5 time frame, the pair's movement was almost perfect on Tuesday. Firstly, it was a trend movement, which is always good for traders. Secondly, strong signals were produced near the important levels. The price rose to 1.1228 by the middle of the European session. Two pullbacks from this mark allowed traders to go short. The pair then fell to 1.1165 and rebounded from it. That was the time to close short positions. Meanwhile, it was unwise to go long due to rising geopolitical tensions and the stronger US dollar. Amid the ongoing armed conflict in Ukraine, it would be unwise to buy risk assets. It is important that beginner traders understand it. So, the pair then went below the level of 1.1165, which created a perfect opportunity for short positions, approached 1.113, and headed towards 1.1106 where trades could have been closed. Generally speaking, beginner traders could have opened two profitable short positions on Tuesday.
Trading plan for Wednesday:
In the 30M time frame, a bearish trend has emerged. However, the high likelihood of a further decrease in the price does not guarantee that there will be no stages of growth. Firstly, the market remains almost in a state of panic. Secondly, there is no trend line. Lastly, the movements could be strong and hard to predict. Therefore, you should be extremely cautious when trading the pair and remember to use a stop-loss order. The target levels in the 5M time frame are seen at 1.0990, 1.1106, 1.1136, 1.1165 1.1228, and 1.1279-1.1292. A stop-loss order should be set at the breakeven point as soon as the price passes 15 pips in the right direction. The CPI for February will be released in the eurozone today. This report may somehow affect the market. Inflation in the eurozone is expected to accelerate to 5.4% y/y. However, the reaction of traders to the data will be hard to foresee due to a difficult geopolitical situation. The ADP jobs report in the US will hardly attract traders' attention either. Fed Chair Powell's testimony in Congress will be the key event on Wednesday.
Basic principles of the trading system:
1) The strength of the signal depends on the time period during which the signal was formed (a rebound or a break). The shorter this period, the stronger the signal.
2) If two or more trades were opened at some level following false signals, i.e. those signals that did not lead the price to Take Profit level or the nearest target levels, then any consequent signals near this level should be ignored.
3) During the flat trend, any currency pair may form a lot of false signals or do not produce any signals at all. In any case, the flat trend is not the best condition for trading.
4) Trades are opened in the time period between the beginning of the European session and until the middle of the American one when all deals should be closed manually.
5) We can pay attention to the MACD signals in the 30M time frame only if there is good volatility and a definite trend confirmed by a trend line or a trend channel.
6) If two key levels are too close to each other (about 5-15 pips), then this is a support or resistance area.
How to interpret a chart:
Support and resistance levels can serve as targets when buying or selling. You can place Take Profit near them.
Red lines are channels or trend lines that display the current trend and show which direction is better to trade.
MACD indicator (14,22,3) is a histogram and a signal line showing when it is better to enter the market when they cross. This indicator is better to be used in combination with trend channels or trend lines.
Important speeches and reports that are always reflected in the economic calendars can greatly influence the movement of a currency pair. Therefore, during such events, it is recommended to trade as carefully as possible or exit the market in order to avoid a sharp price reversal against the previous movement.
Beginner traders should remember that every trade cannot be profitable. The development of a reliable strategy and money management is the key to success in long-term trading.


