


What is needed to open long positions on GBP/USD
In my morning article, I directed your attention to 1.3270 and recommended making trading decisions with this level in focus. Now let's have look at the 5-minute chart and try to figure out what has actually happened. A rapid breakout of 1.3303 without the opposite test upwards did not generate any sell signal for GBP. Nevertheless, we could clearly see buying activity at nearly 1.3270 at a false breakout. It pushed GBP up to 1.3303 that enabled traders to earn almost 30 pips. The pair made a few failed attempts to climb above 1.3303 and generated a sell signal. The price declined by 25 pips. The bulls managed to break 1.3303 with the second attempt. Thus, the price settled above that level, creating a nice point for opening long positions. The technical picture remains the same in the second half of the day. So does the trading strategy.
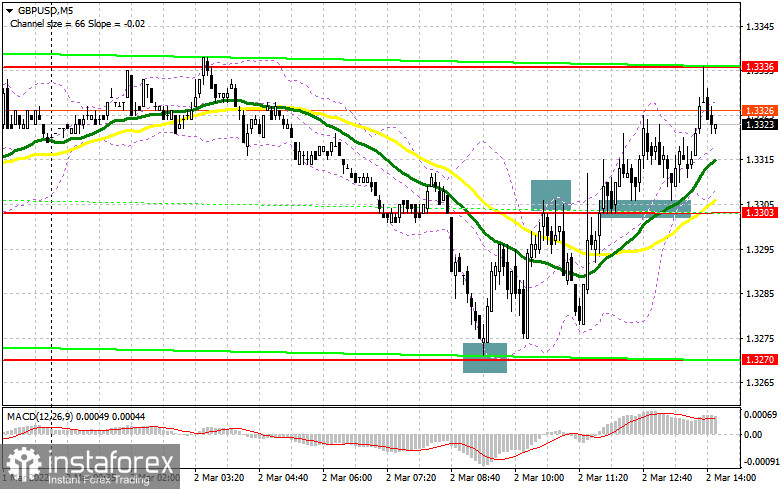
As long as GBP settles above 1.3303, we can bet on its strength. Representatives from Russia and Ukraine have fixed the nearest meeting to discuss the complicate geopolitical situation. The news supports demand for risky assets. The economic calendar reminds us about a series of fundamental reports from the US that is due in the second half of the day. On top of that, the eyes are on Jerome Powell's speech that might reinforce the US currency again. Indeed, inflation is likely to leap to new historic highs in the near future. It will assure the US central bank to take drastic measures. The Fed's leader might shed light on such policy moves in his speech today.
The major task for the bulls is to defend support of 1.3303 in the second half of the day. The best scenario would be buying in case the pair declines and makes a false breakout there. However, the pair has to jump vigorously shortly after like it happened during the European session. GBP could tumble after the publication of ADP employment report. Importantly, it will be the second test of 1.3303 today. If the pair doesn't develop rapid growth and the US releases good economic data, I would recommend you cancel long positions until the swing low at 1.3232 or lower at 1.3200, bearing in mind a 20-25-pips correction intraday. To halt the bearish trend, the bulls have to push the price into closing the day above 1.3336. It will activate stop loss orders of the sellers. However, this is a challenging task under current market conditions. In case of poor economic data from the US, a breakout and a test of 1.3336 will extend the upward correction of GBP/USD. In this case, the price could extend its climb towards 1.3369 and 1.3405.
What is needed to open short positions on GBP/USD
The bears asserted themselves, but the bulls enabled the upward move from lows of February, thus preventing a large sell-off. A lot will depend on the US economic data and the speech by Jerome Powell in front of the Senate Committee. A false breakout of the area between 1.3336 and the nearest resistance will produce an excellent point for opening short positions with a further decline and a breakout if support at 1.3303. If the buyers lack activity there and if this level is tested upwards, we will have an extra entry point for short positions with downwards targets at 1.3270 and 1.3232. 1.3200 is seen as a more distant target where I recommend profit taking. In case GBP/USD grows during the American session and if the sellers lack activity at 1.3336, it would be better to cancel selling. By the way, 1.3336 is the level where moving averages are passing, playing in favor of the sellers. If 1.3336 is wrecked, GBP could surge, activating stop orders of the sellers. In this case, it would be better to open short positions on GBP/USD immediately at a drop off 1.3360 or higher from 1.3405, bearing in mind a 20-25-pips correction intraday.
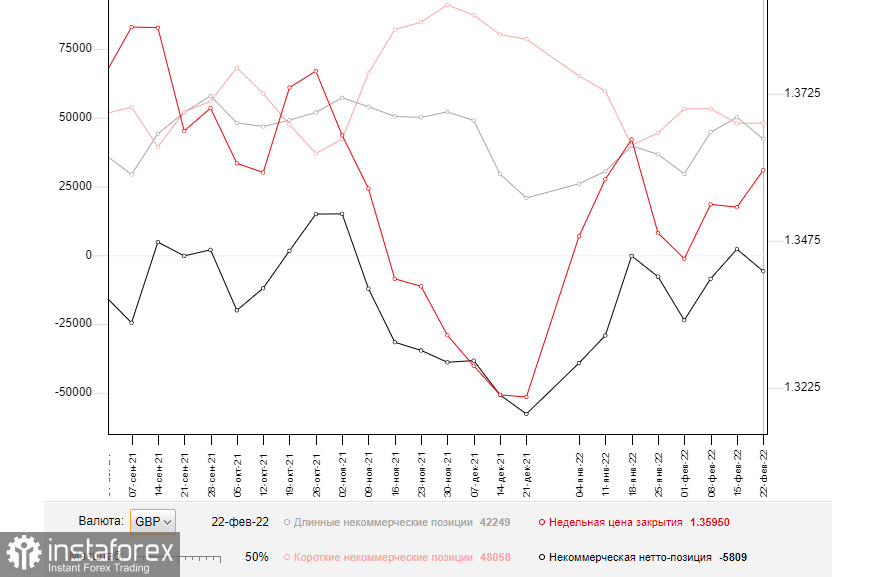
The COT report from February 22 reveals a sharp rise of short positions and contraction of long positions. As a result, the delta has turned negative again. Notably, the market keeps equilibrium even under the military hostilities.
On the back of the severe geopolitical conflict that affected the whole world, no one is surprised to see traders increasing short positions on risky assets. The latest COT report did not include a sell-off that hit the market at the end of the last week. It doesn't make sense to speculate on further policy moves of the Bank of England or the Federal Reserve. Indeed, if geopolitical tensions get worse, monetary policy moves will be of no importance. Now Russia and Ukraine are holding the talks. So, market sentiment will entirely depend on the outcome. Markets are anticipating a few rounds of the talks. Under such conditions, COT reports are taking the back seat. They are commonly of secondary importance for traders. I would strongly advise you to trade risky assets cautiously for the time being. It would be better to buy GBP at some signs of easing tensions among Russia, Ukraine, the US, and the EU. Any new sanctions towards Russia would entail grave economic consequences that will put a strain on financial markets.
According to the COT report from February 22, long non-commercial positions decreased from 50,151 to 42,249 whereas short non-commercial positions grew from 47,914 to 48,058. This produced a negative value of non-commercial net positions from 2,247 to -5,809. GBP/USD closed last week higher at 1.3591 against 1.3532 a week ago.
Indicators' signals:
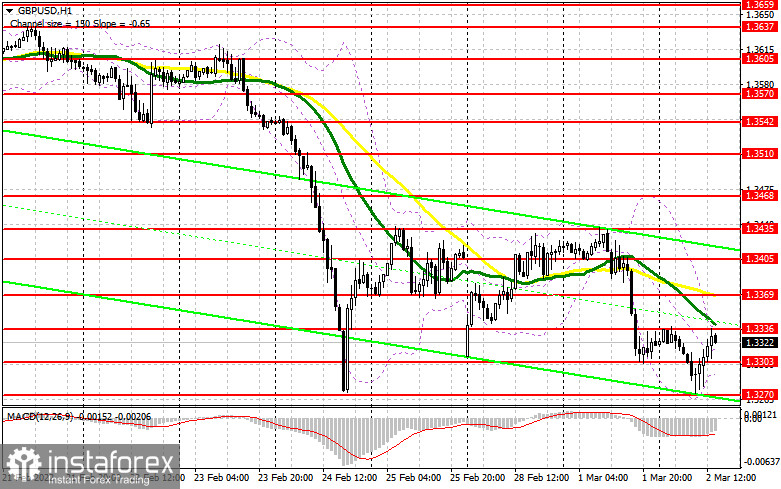
Trading is carried out below the 30 and 50 daily moving averages. It indicates the ongoing bearish trend.
Moving averages
Note: The period and prices of moving averages are considered by the author on the H1 hourly chart and differs from the general definition of the classic daily moving averages on the daily D1 chart.
Bollinger Bands
A breakout of the indicator's upper border at 1.3336 will trigger a new bullish wave. Alternatively, a breakout of the indicator's lower border at 1.3285 will put the currency pair under pressure.
Description of indicators
- Moving average (moving average, determines the current trend by smoothing out volatility and noise). Period 50. It is marked yellow on the chart.
- Moving average (moving average, determines the current trend by smoothing out volatility and noise). Period 30. It is marked green on the chart.
- MACD indicator (Moving Average Convergence/Divergence — convergence/divergence of moving averages) Quick EMA period 12. Slow EMA period to 26. SMA period 9
- Bollinger Bands (Bollinger Bands). Period 20
- Non-commercial speculative traders, such as individual traders, hedge funds, and large institutions that use the futures market for speculative purposes and meet certain requirements.
- Long non-commercial positions represent the total long open position of non-commercial traders.
- Short non-commercial positions represent the total short open position of non-commercial traders.
- Total non-commercial net position is the difference between short and long positions of non-commercial traders.


