


EUR/USD
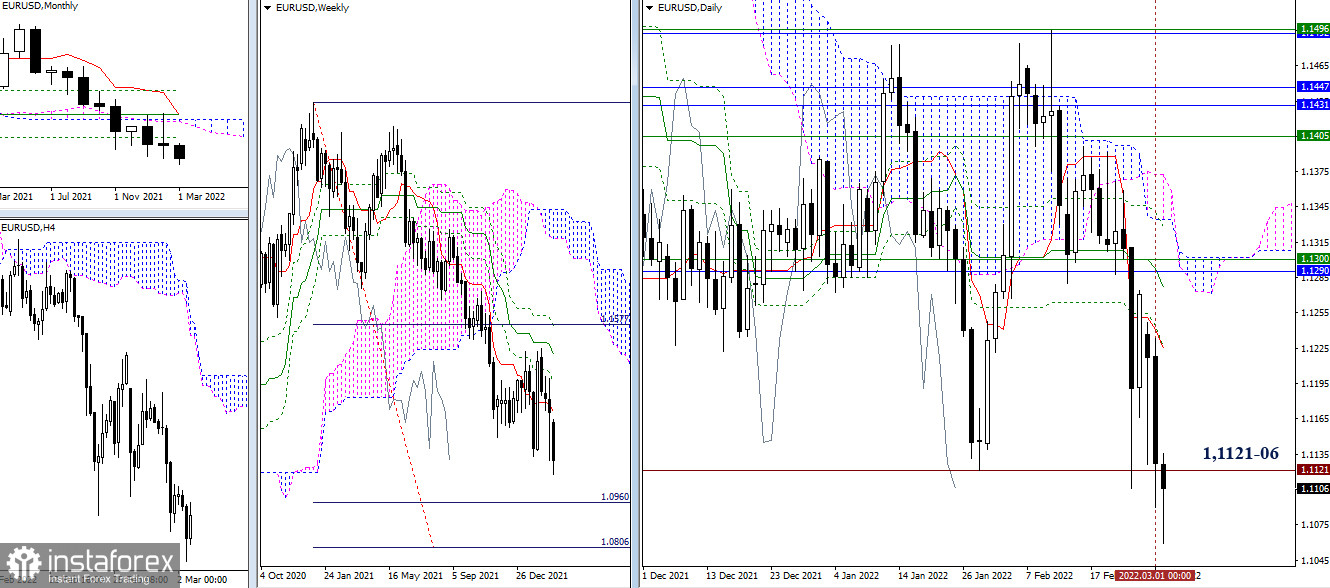
The confrontation at the boundaries of the previous lowest extremum points (1.1121-06) continues. If the bears win, they will go to test the strength of the downward target for the breakdown of the weekly cloud (1.0960 – 1.0806). If bulls manage to stop the fall, they will rise to upside targets at 1.1225 (daily levels) and 1.1290 – 1.1300 (weekly short-term trend + final level of the monthly cross).
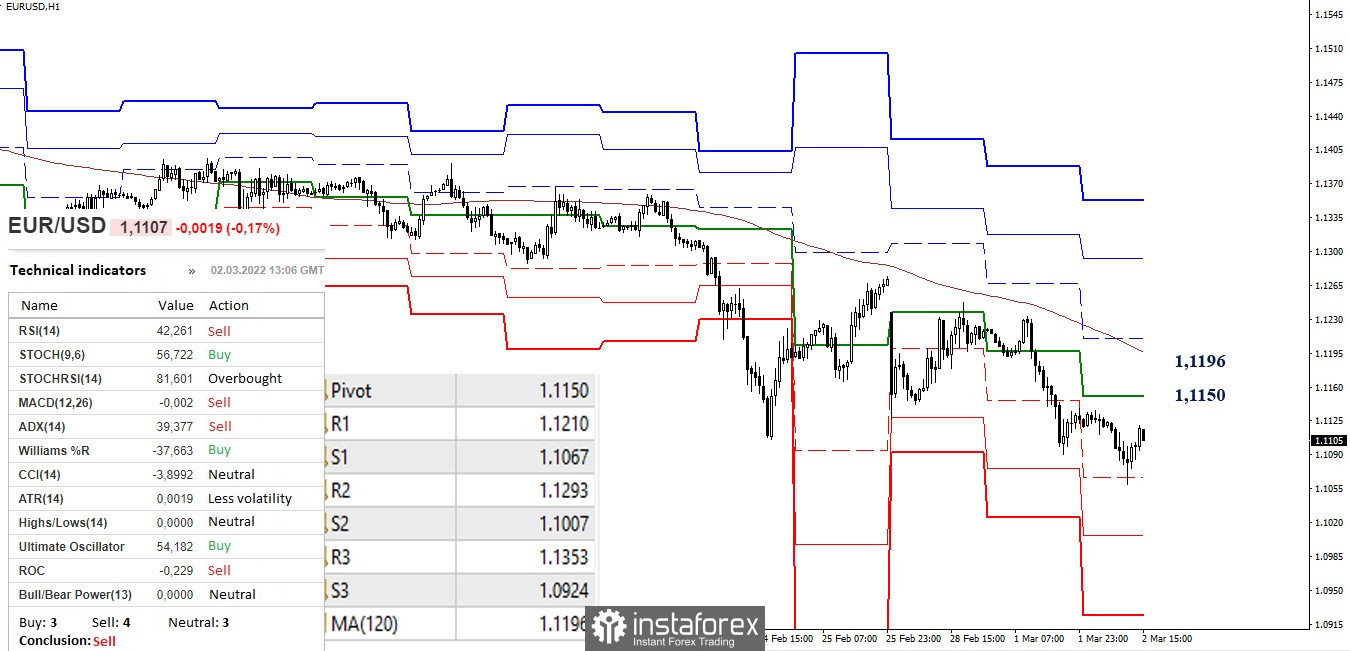
In the lower timeframes, the advantage currently belongs to the bears. A few hours ago, they tested S1 (1.1067), then S2 (1.1007) and S3 (1.0924) are placed as reference points for further decline. The key levels of the lower timeframes today act as resistance and hold the line at 1.1150 (the central pivot point) and 1.1196 (the weekly long-term trend).
***
GBP/USD
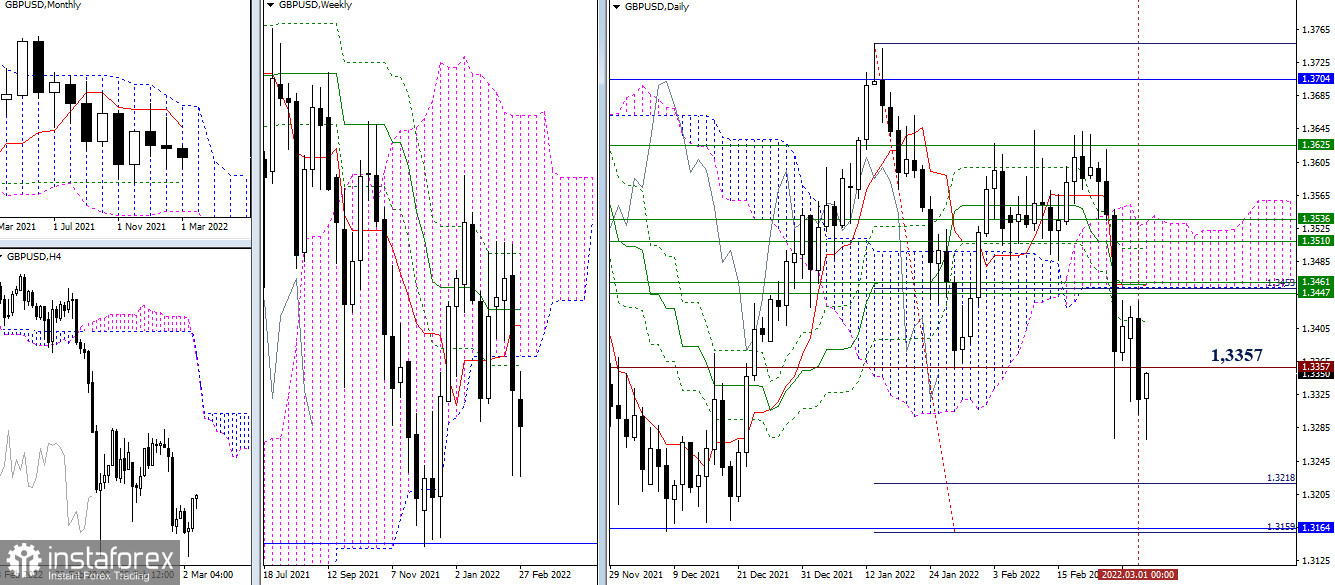
Yesterday, bears closed the day below 1.3357 (previous extremum). As a result, their main target for continuing the decline is now reference points 1.3218 - 1.3164 - 1.3159 (monthly Fibo Kijun + daily target for the breakout of the Ichimoku cloud). If the breakdown is not confirmed, then the interests of the bulls will return to the market, and the resistance on their way will again be 1.3413 (daily Fibo Kijun) and 1.3447-61 (weekly levels + daily cross and the lower boundary of the cloud).
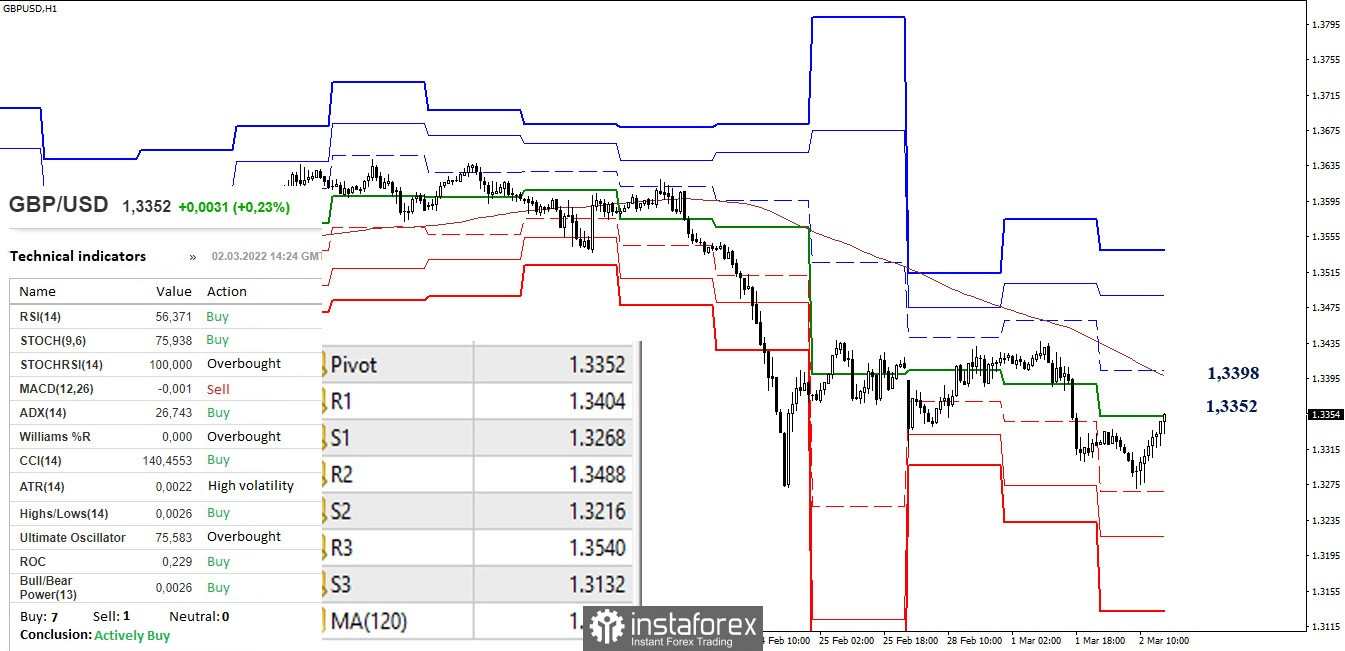
At the moment, in the lower timeframes, the nascent corrective rise has led to testing of the first key resistance at 1.3352 (the central pivot point). Further, the interests of bulls will be directed to the weekly long-term trend (1.3398). Overcoming and reversal of the moving average can change the current balance of power.
***
Kinko Hyo (9.26.52) and Kijun-sen levels in the higher time frames, as well as Classic Pivot Points and Moving Average (120) on the H1 chart, are used in the technical analysis of the trading instruments.


