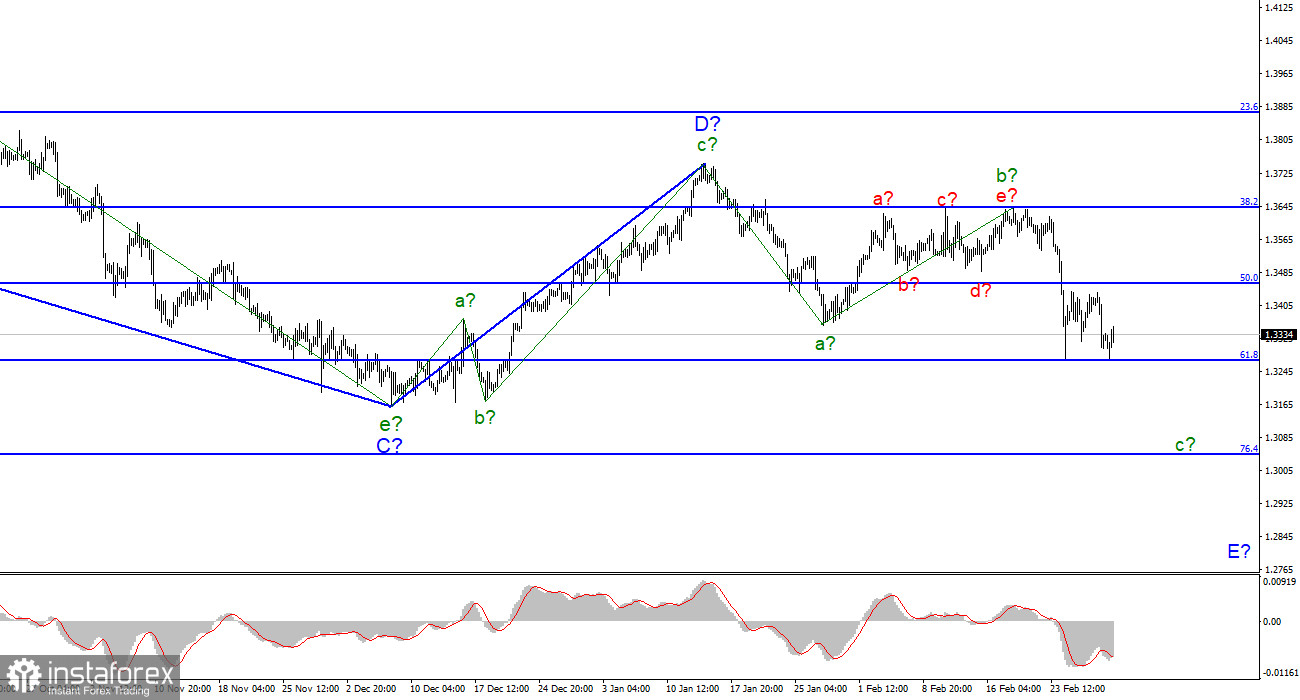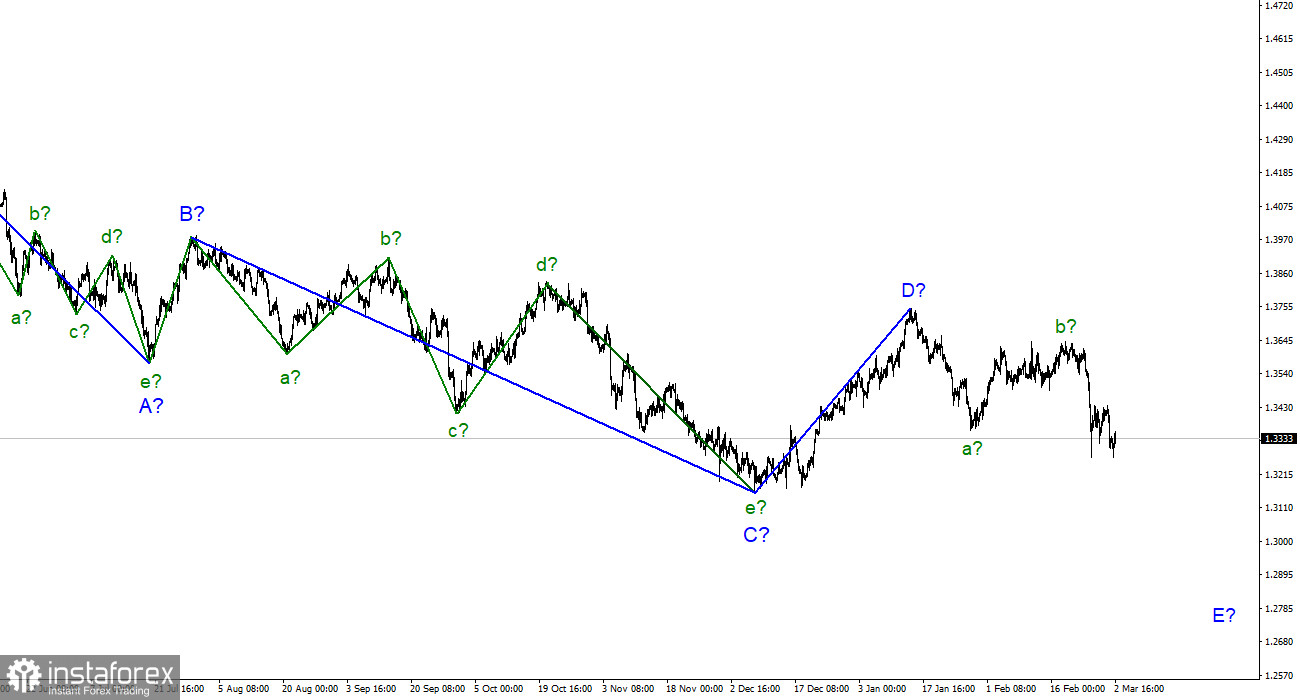
The wave analysis of the pound/dollar pair looks convincing. Wave b in E of the downward section of the trend has become more complicated. However, it ended after several unsuccessful attempts to break 1.3642. A decline in the quotes points to the formation of wave c, which could be quite long. By the moment, the pair has broken the low of wave a. That is why the downward section will last until it touches wave a. Thus, the downward section of the trend consists of 5 waves. Wave E also may consist of 5 waves and become longer. Wave c in E does not look complete. It is too short and the current news flow may contribute to the mounting demand for the US dollar.
On March 2, the pound/dollar pair increased by 20 pips. The pound has been trying to avoid a decline for the last four days. However, according to the wave analysis, the asset is likely to drop. The instrument may form a complicated correctional and horizontal structure. Notably, the pound sterling failed to climb above 1.3430 three times. Even the current wave is not complete.
We are not going to ficus on the news flow since it is very poor. There is no economic information from the UK now. Yesterday, it published just one report that did not attract traders' attention. Today, the US published its ADP employment change report, which unveiled a rise of 475,000. The data exceeded the forecast, but demand for the US dollar remained unchanged. It seems that the market is not ready to price in macroeconomic reports and is still focused on geopolitical news. Today, Fed Chair Jerome Powell has provided a speech. Also today, the US will publish its Beige Book. I suppose that Powell's speech may affect the market, whereas Beige Book will hardly do so. Tomorrow, the news flow is likely to be the same. Thus, the market is unlikely to price in any macroeconomic events. However, early tomorrow, we may learn about the results of the meeting between Ukraine and Russia. We expect a positive result that will calm down markets.
Conclusion
The wave picture of the pound/dollar pair presupposes the formation of wave E. Wave b is finished. The trading instrument made two unsuccessful attempts to break 1.3645 that led to the beginning of a new movement. The failure to break 1.3274 pushed the asset a bit higher. However, it is better to open sell orders with the targets near 1.3046, the 76.4% Fibonacci level, after the MACD indicator provides a downward signal. The fact is that wave c in E does look complete.

On a bigger time frame, wave D also looks finished, whereas the whole downward section of the trend is incomplete. That is why in the next few weeks, I expect the asset to continue falling below the low of wave C. Wave D consists of three waves. That is why I cannot consider it wave 1 of a new upward section of the trend.


