


Analyzing trades on Wednesday:
EUR/USD on 30M chart
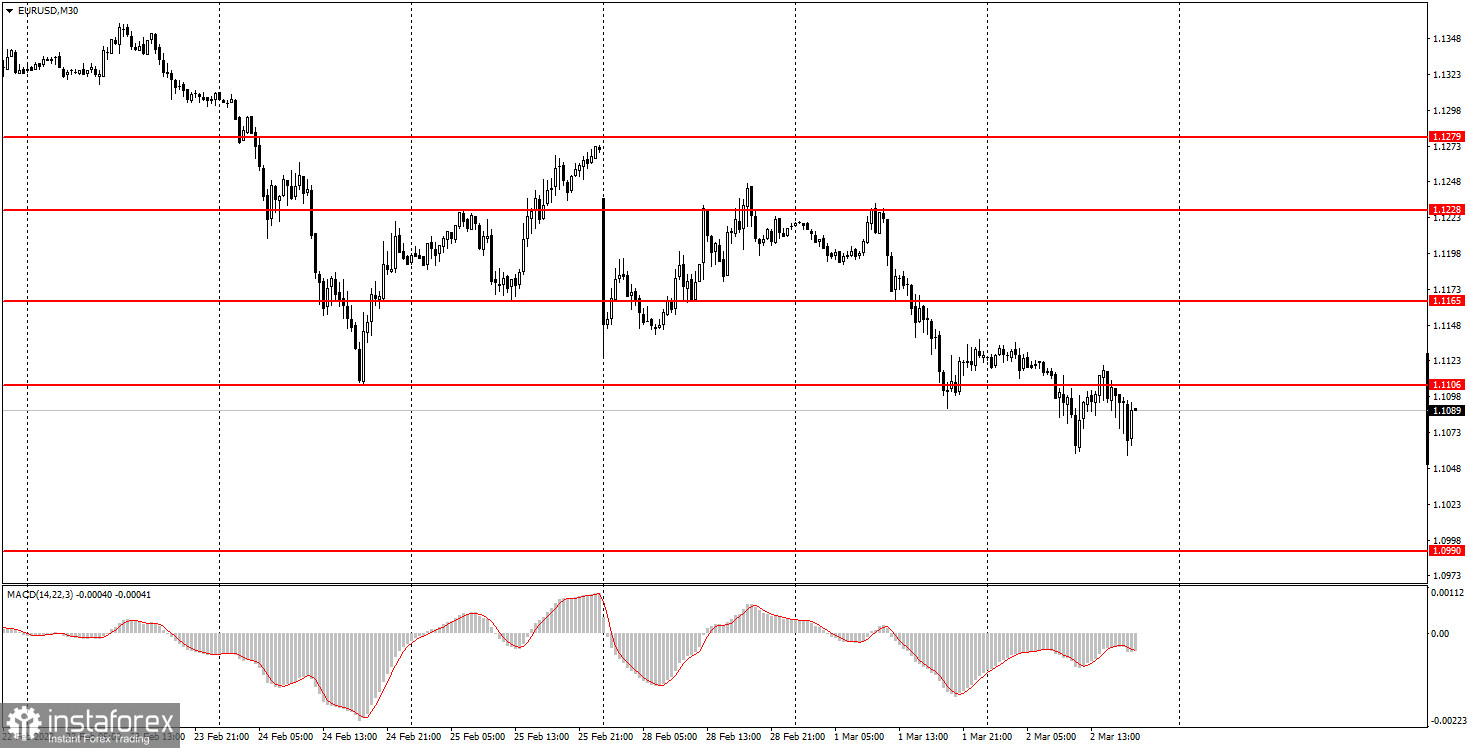
On Wednesday, the EUR/USD pair was trading in a usual mode. At first, it was trading mixed and then it made sharp and rapid movements. Besides, there was no trend again. The downtrend persists at the moment but this does not mean that the euro will be falling every day. On Wednesday, the pair grew and declined twice, so it was very difficult to trade. As for the macroeconomic background, the inflation report in the EU and the ADP report in the US were published on Wednesday. Both of them were ignored by the market, which is not surprising at all. Only in the late afternoon, the US dollar began to fall sharply. The reason for this could be the speech of Fed Chairman Jerome Powell who probably did not live up to the hawkish expectations of traders. In general, the situation remains the same: geopolitics comes first.
EUR/USD on 5M chart
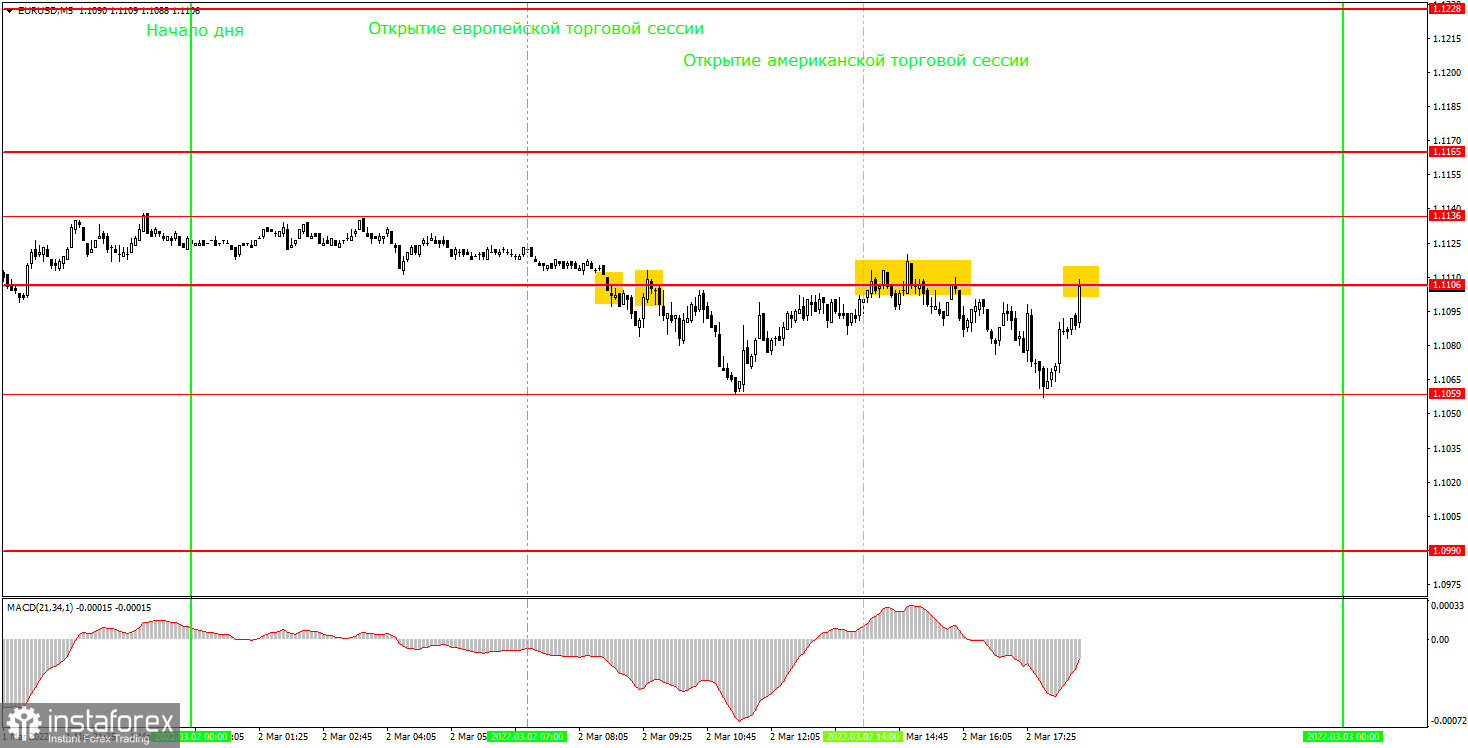
On the 5-minute time frame on Wednesday, the pair's movements were uneven but still not so bad. All trading signals of the day were formed around the level of 1.1106. The 1.1059 level was the daily low and there was no trading activity near it. First, the pair settled below the level of 1.1106 and after half an hour rebounded from it. Thus, two sell signals were formed at once. After their formation, the price went down by about 40 pips, but it was still very far from the target level of 1.0990. So, novice traders had to close their positions manually. Anyway, as the Stop Loss was set to breakeven, it was impossible to lose with this trade. The next sell signal was formed during the North American trading session when the price bounced off the 1.1106 level again. This time the pair dropped by 40 pips, so beginners could have earned some more pips on this trade. After the start of Jerome Powell's speech, volatility increased sharply, so trades should not have been opened at this time.
Trading tips on Thursday:
A downtrend has formed on the 30-minute time frame and it is still relevant. However, given the instability of the markets due to the geopolitical situation, the price movements can be very volatile with sharp reversals. You should be as careful as possible and do not forget about Stop Loss orders. In general, we expect the downward movement to continue in the next few weeks. On the 5-minute chart on Thursday, we recommend trading at the levels of 1.0990, 1.1059, 1.1106, 1.1136, 1.1165, and 1.1228. You should set a Stop Loss to breakeven as soon as the price passes 15 pips in the right direction. On Thursday, the European Union will publish the index of business activity in the services sector and the data on the unemployment rate. In current circumstances, these reports are of minor importance. The ECB's report on monetary policy is also unlikely to impress traders as well. As for the US, an important ISM report and another speech by Jerome Powell may be taken into account by market players.
Basic rules of the trading system
1) The strength of the signal is determined by the time it took the signal to form (a rebound or a breakout of the level). The quicker it is formed, the stronger the signal is.
2) If two or more positions were opened near a certain level based on a false signal (which did not trigger a Take Profit or test the nearest target level), then all subsequent signals at this level should be ignored.
3) When trading flat, a pair can form multiple false signals or not form them at all. In any case, it is better to stop trading at the first sign of a flat movement.
4) Trades should be opened in the period between the start of the European session and the middle of the US trading hours when all positions must be closed manually.
5) You can trade using signals from the MACD indicator on the 30-minute time frame only amid strong volatility and a clear trend that should be confirmed by a trendline or a trend channel.
6) If two levels are located too close to each other (from 5 to 15 pips), they should be considered support and resistance levels.
On the chart
Support and Resistance Levels are the levels that serve as targets when buying or selling the pair. You can place Take Profit near these levels.
Red lines are channels or trend lines that display the current trend and show in which direction it is better to trade now.
The MACD indicator (14, 22, and 3) consists of a histogram and a signal line. When they cross, this is a signal to enter the market. It is recommended to use this indicator in combination with trend patterns (channels and trendlines).
Important announcements and economic reports that can be found on the economic calendar can seriously influence the trajectory of a currency pair. Therefore, at the time of their release, we recommend trading as carefully as possible or exiting the market in order to avoid sharp price fluctuations.
Beginners on Forex should remember that not every single trade has to be profitable. The development of a clear strategy and money management is the key to success in trading over a long period of time.


