


Details of the economic calendar for March 2:
The inflation rate in the eurozone broke a new record, so consumer prices jumped in February by 5.8% in annual terms. Economists emphasize that against the backdrop of the general situation in the world, inflation will continue to rise.
During the American trading session, ADP published a report on the level of employment in the United States. According to the report, in February, employment increased by a seasonally adjusted 475,000 compared to an increase of 378,000. In January, the number of jobs in the U.S. private sector increased by 509,000, revised from -301,000.
There was no market reaction to the positive data on the U.S., due to the fact that the dollar had grown so much in price the day before.
Analysis of trading charts from March 2
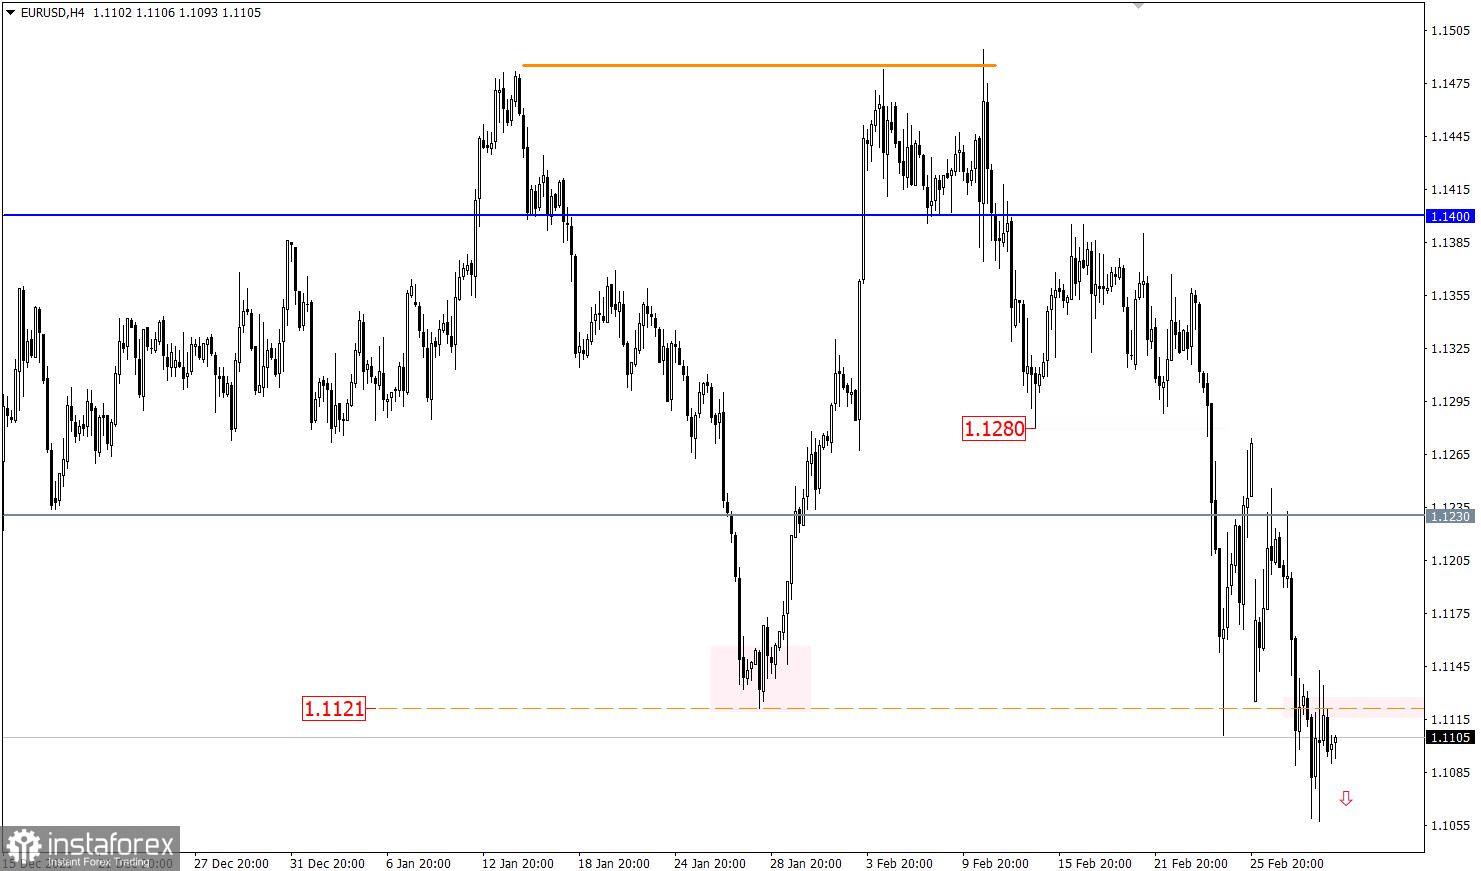
The EURUSD currency pair has updated the local low of the downward trend. As a result, the quote rushed down, closely approaching the psychologically important level of 1.1000 (1.0950/1.1000/1.1150).
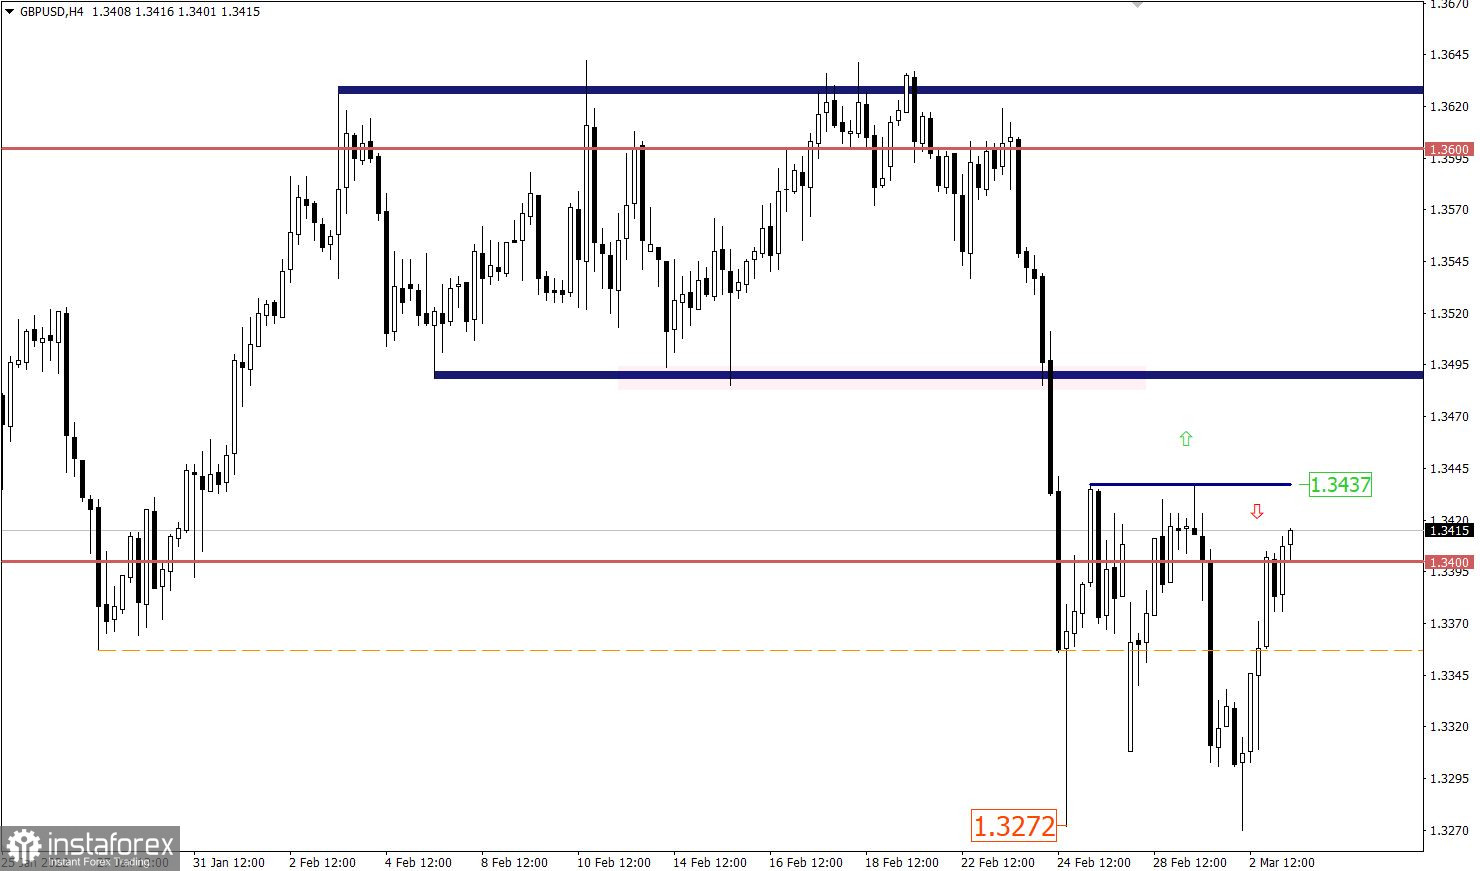
The GBPUSD currency pair did not manage to overcome the local low of the past week - 1.3272. As a result, the price rebounded, which led to a reverse movement, winning back most of the decline since the beginning of the trading week.

March 3 economic calendar:
Data on business activity in the EU, Britain, and the United States will be published today, which could put pressure on the market if it were not for the constant information and news flow about the current situation in the world.
At the same time, jobless claims should be hidden by 8,000, but this is a minor change, thus the data can be ignored by the market.
Time targeting
Indices for business activity in the EU - 09:00 Universal time
Indices for business activity in Britain - 09:30 Universal time
U.S. Jobless Claims - 13:30 Universal time
Indices for business activity in the U.S. - 14:45 Universal time
Information and news noise
The information flow will continue to put pressure on the market, which will affect the speculative mood of traders.
Trading plan for EUR/USD on March 3:
At the moment, there is a slight slowdown in the downward cycle, where a psychologically important level serves as a support. This move may lead to a reduction in the volume of short positions, which will temporarily deter sellers from further decline. It is worth considering that dollar positions are still considered the most attractive in the medium term. Therefore, a temporary stagnation or rollback will cause a regrouping of trading forces in the market, which will lead to a breakdown of the level of 1.1000.
Trading plan for GBP/USD on March 3:
In this situation, the role of resistance on the way of buyers is played by the level of 1.3437, where earlier in history there was a reduction in the volume of short positions. In this case, there may be a slowdown in the upward cycle and, as a result, a price rebound.
An alternative market development scenario will be considered by traders if the price holds above 1.3450 in a four-hour period.
What is reflected in the trading charts?
A candlestick chart view is graphical rectangles of white and black light, with sticks on top and bottom. When analyzing each candle in detail, you will see its characteristics of a relative period: the opening price, closing price, and maximum and minimum prices.
Horizontal levels are price coordinates, relative to which a stop or a price reversal may occur. These levels are called support and resistance in the market.
Circles and rectangles are highlighted examples where the price of the story unfolded. This color selection indicates horizontal lines that may put pressure on the quote in the future.
The up/down arrows are the reference points of the possible price direction in the future.


