


When to open long positions on GBP/USD:
A few strong signals were made on Friday. Let's look at the M5 chart and analyze it. In my previous analysis, I paid attention to the level of 1.3314 and said you could consider entering the market from it. A false breakout and a sell signal occurred after a breakout and a failed attempt of bulls to return to the market. The price went down by 50 pips to 1.3270 as a result. In the second half of the day, a signal to sell the pair was generated after the release of US labor market data. The quote lost another 70 pips and approached 1.3200.
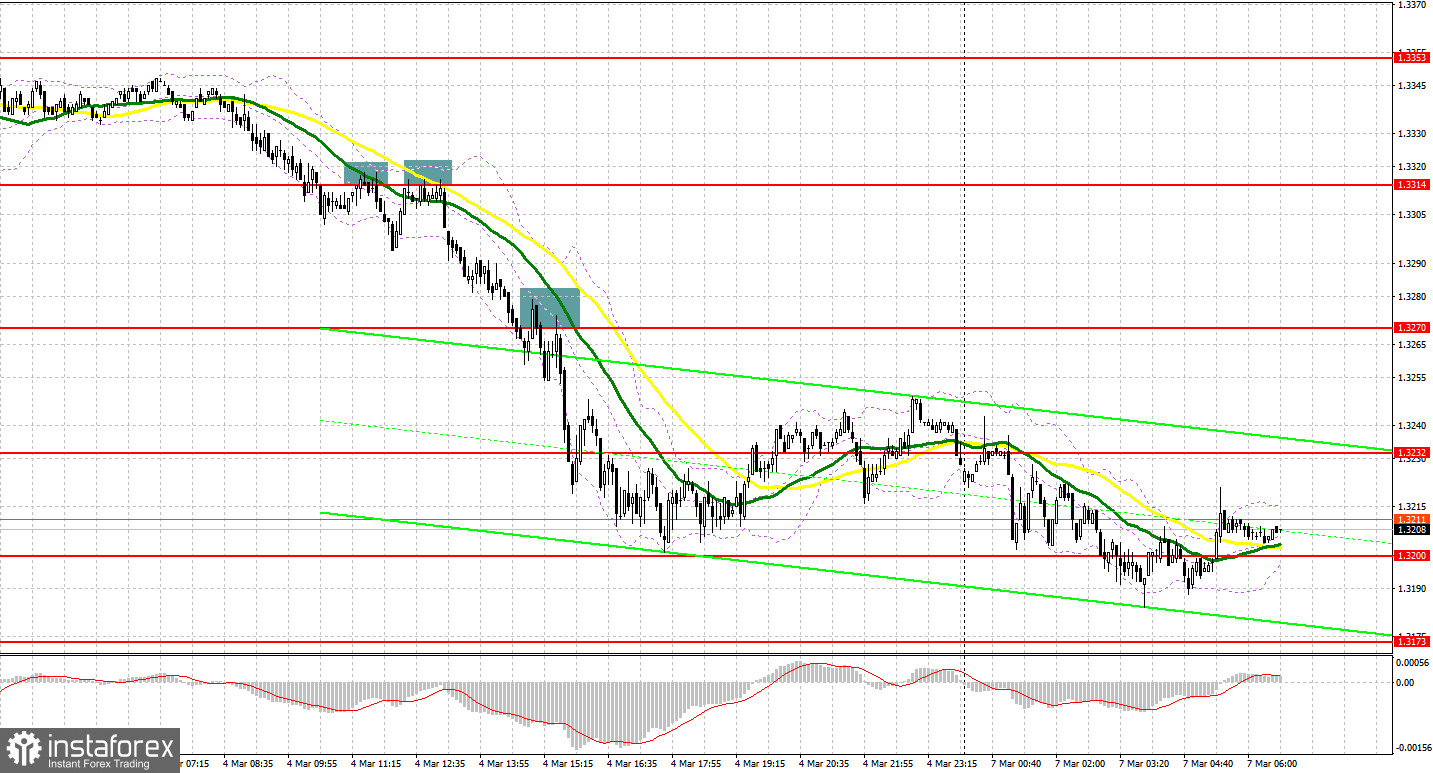
The US Federal Reserve is likely to take a more aggressive stance on monetary policy given the recent optimistic results of the US labor market. This will surely provide support for the greenback and contribute to its strengthening against risk assets, including the pound. Today's macroeconomic calendar contains only the house price index, which is unlikely to boost the pound that was incurring losses in the Asian session. Bulls will try to protect the support level of 1.3195 in the European session. A false breakout there will provide an opportunity for long positions since the entry will be against the bear market. In this-case scenario, the pound may increase to the 1.3235 resistance level. A breakout and a retest of this range top-bottom could trigger the stop orders of sellers, allowing the pair to recover. In such a case, the 1.3273 level will serve as a target, in line with the bearish moving averages. If the 1.3314 resistance level is updated, the pair will be able to recoup half of its Friday losses. You could consider taking a profit there. If GBP/USD goes down in the European session and bullish activity decreases at 1.3195, long positions could be opened after the price has reached support at 1.3157 and a false breakout has occurred. In addition, it will be possible to purchase GBP/USD immediately on a rebound from 1.3111 or the 1.3070 low, allowing a 20-25 pips intraday correction.
When to open short positions on GBP/USD:
Bears are keeping control of the market as sanctions bite, weighing on the global market. Under the circumstances, the pound is getting weaker along with the Russian ruble. A sell-off is ongoing due to the tense situation in Ukraine. It is likely to continue until the parties involved in the conflict achieve some breakthrough. However, it seems that neither of them is willing to continue peace talks. Bears will try to protect the 1.3195 support level today. At the same time, 1.3235 is another important mark. A false break at 1.3295 along with weak data on the house price index in the UK will make the first sell signal with the target at 1.3195. A breakout and a retest of this range will increase the pressure on the pair, and the bearish trend will continue, providing another entry point to sell the asset with the target at the 1.3157 low. If geopolitical tensions escalate further, the price will head towards 1.3111 and 1.3070 where you should consider taking a profit. If GBP/USD goes up in the European session and bearish activity decreases at 1.3235, short positions could be opened after the price has reached 1.3273 and a false breakout has occurred. In addition, it will be possible to sell GBP/USD immediately on a bounce from 1.3314 or the 1.3353 high, allowing a 20-25 pips intraday correction.
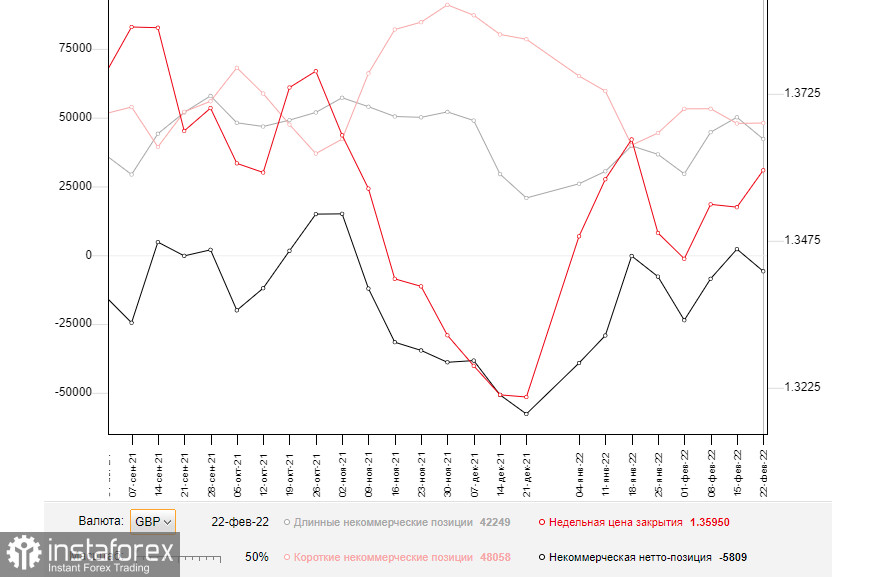
Bank of England's nor the Federal Reserve's stance on monetary policy now matters as the armed conflict is getting more tense. Russia and Ukraine have agreed to hold peace talks. A lot will depend on the outcome of these meetings. Under the current circumstances, the COT report might seem less accurate given its minor importance for traders. You should be cautious enough when trading risk assets and buy the pound if only tensions between Russia and Ukraine, the EU, and the US ease. Any new sanctions against Russia will have dire economic consequences and harm financial markets. The COT report for February 22 revealed a decrease in long non-commercial positions to 42,249 versus 50,151 and a rise in short non-commercial positions to 48,058 from 47,914. The total weekly non-commercial net position plunged to -5,809 from 2 247. The weekly closing price grew to 1.3592 versus 1.3532.
Indicator signals:
Moving averages
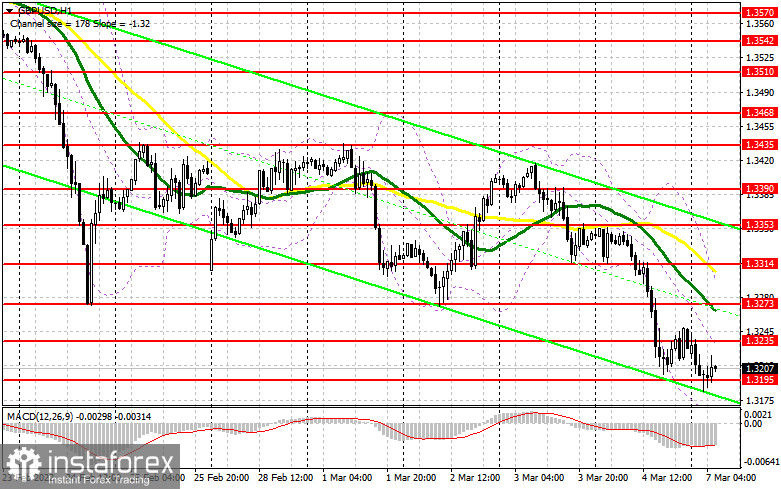
Trading is carried out below the 30-day and 50-day moving averages, indicating the continuation of the bearish market.
Note: The period and prices of moving averages are viewed by the author on the hourly chart and differ from the general definition of classic daily moving averages on the daily chart.
Bollinger Bands
A breakout at 1.1190 is likely to cause a fall in the euro. In the case of bullish bias, resistance will stand at 1.1235, the upper band. If the pair goes down, the lower band at 1.3157 will stand as support. Otherwise, if it goes up, the upper band at 1.3275 will serve as resistance.
Indicator description:
- Moving average (MA) determines the current trend by smoothing volatility and noise. Period 50. Colored yellow on the chart.
- Moving average (MA) determines the current trend by smoothing volatility and noise. Period 30. Colored green on the chart.
- Moving Average Convergence/Divergence (MACD). Fast EMA 12. Slow EMA 26. SMA 9.
- Bollinger Bands. Period 20
- Non-commercial traders are speculators such as individual traders, hedge funds, and large institutions who use the futures market for speculative purposes and meet certain requirements.
- Long non-commercial positions are the total long position of non-commercial traders.
- Non-commercial short positions are the total short position of non-commercial traders.
- Total non-commercial net position is the difference between short and long positions of non-commercial traders.


