Let us look at the technical analysis of another major pair, USD/CHF. We will start with the weekly chart.
Weekly chart

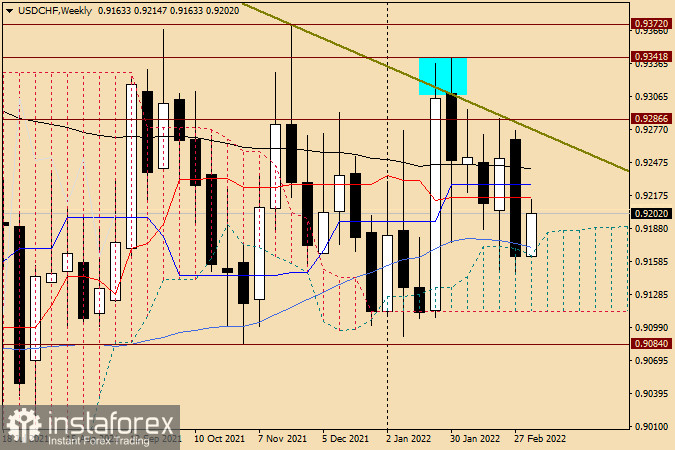
After two failed attempts to break through the resistance area of 1.0022-0.9372, the usd/chf bulls lost control over the market. I marked these points on the chart. As we can see, there are candlestick shadows left above the resistance line, while the price closed below this resistance level. This is what we call a false breakout. In the course of the previous week, the pair showed a strong decline. Amid the tense geopolitical situation caused by the military conflict between Russia and Ukraine, market participants preferred to buy the Swiss franc. Notably, both the US dollar and the Swiss franc are considered safe haven currencies depending on the situation and the market sentiment.
As we can clearly see on the chart, the price failed to reach the resistance at 1.0022-0.9372 and initiated an extended downtrend. As a result, the quote broke through the black 89-day exponential moving average, the blue Kijun and the red Tenkan lines of the Ichimoku Cloud. However, bears did not stop there and continued to push the pair lower. This resulted in a breakout of the 50-day simple moving average and the weekly close within the Ichimoku Cloud. Judging by the technical picture on the weekly chart, the downward movement is very likely to continue. In this case, the nearest target for the pair will become the lower boundary of the Ichimoku Cloud located at 0.9114. For the bullish trend to resume, the quote needs to rise above the broken indicators and make a real breakout of the resistance area at 1.0022-0.9372.
Daily chart

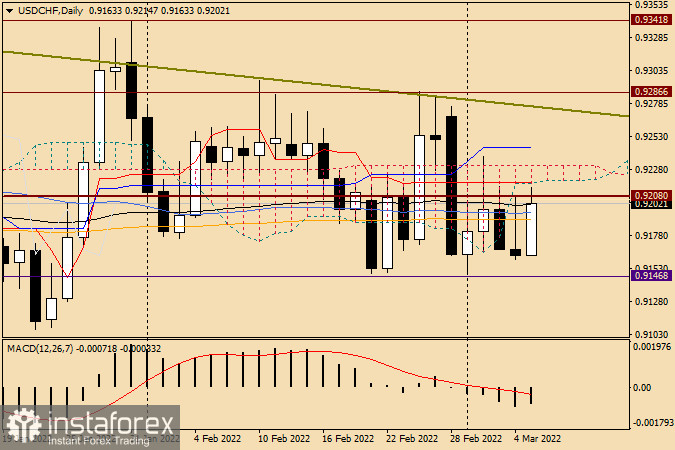
Despite strong data on US employment on Friday, the pair failed to develop an uptrend. It seems that the geopolitical factor is more important for investors now. Judging by the candlestick formed on March 4, the price made an attempt to return above the strong technical level of 0.9200 but it did not succeed. This left Friday's candlestick with a very long upper shadow. As we can clearly see on the daily chart, bulls have faced all three moving averages that acted as strong resistance. In my opinion, the main recommendation is to sell USD/CHF after it completes corrective pullbacks to the price area of 0.9190-0.9200. If bullish candlestick patterns appear on this or lower time frames when approaching the support area at 0.9150, this should be taken as a signal to buy the pair. In both cases, I do not recommend setting distant targets as the situation with the USD/CHF pair is still not clear.
Good luck and lots of profit!


