So it's time to consider a pair of North American dollars. The pair is quite interesting and loved by many. Well, let's start the technical analysis of USD/CAD with a weekly timeframe.
Weekly

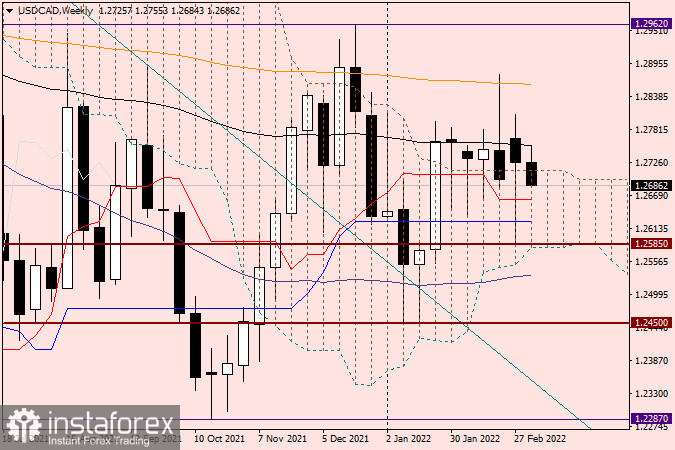
Looking at the weekly chart and at the last candle with a very long lower shadow, I just want to ask myself - what was it? And this is the reluctance of investors to continue selling the pair, based on strong data on the US labor market, as well as taking into account the situation with military operations in Ukraine. Nevertheless, although the US dollar is a protective asset, the Canadian strengthened following the results of the past five days. The "loonie" is supported by rising oil prices. If we highlight purely technical nuances, it is worth noting the inability of USD/CAD bears to complete weekly trading within the Ichimoku indicator cloud. Also, the fact that in addition to the 1.25865 mark, the pair was supported by the red Tenkan line and the blue Kijun line of the Ichimoku indicator, as well as its upper limit, should not escape our attention. The current week has started again with bearish pressure, but a lot can still change during the five-day trading period. In my personal opinion, such a long lower shadow of the previous candle is more inclined to the growth of the pair, and therefore to its purchases.
Daily

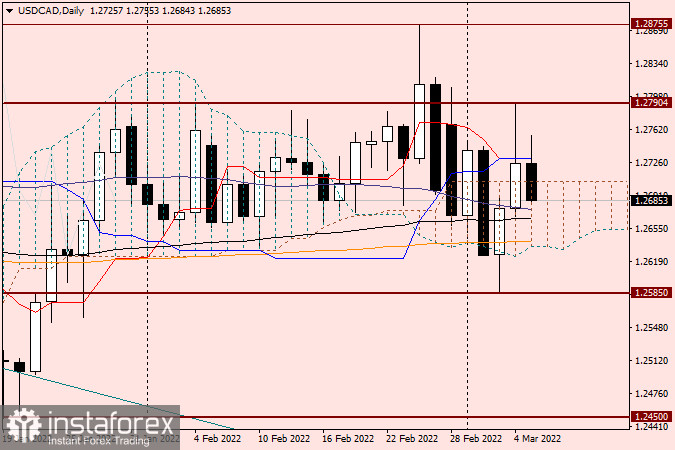
On the daily chart, we see an equally intriguing picture. Although on Friday the pair went up from the Ichimoku indicator cloud, the long upper shadow of the candle for March 4, as well as the closing of trading under the Tenkan and Kijun lines, which converged at 1.2730, I leave questions about the ability of the rate to continue the upward dynamics. At the moment, we see that attempts by USD/CAD to resume growth and go up the Tenkan and Kijun lines are failing again. Now the pair is trading with a slight decrease, and the bears for this trading instrument are trying to return the quote to the limits of the Ichimoku cloud. The trading range in which the "Canadian" is traded can be designated as 1.2790-1.2585. Also, a characteristic technical feature is a factor in finding the used moving averages within the cloud.
This allows you to use a decrease to 50 simple moving average, as well as to 89 exponential moving average to open deals to buy. However, to confirm it, it would be good to see bullish patterns of Japanese candlesticks near these movements at this or smaller time intervals. If you do not hurry and be patient, then it is better to enter the market at USD/CAD after the pair exits the above range of 1.2790-1.2585. In the case of a true breakdown of 1.2790, I recommend buying a pair on a rollback to this level, and if support is broken at 1.25856 and the pair is fixed under this mark, it is worth trying to sell on a rollback to it. In general, in my personal opinion, the US dollar has every chance to be in demand more as a protective asset, since the situation in Ukraine will only worsen.


