


Analysis of Monday's trades:
30M chart of EUR/USD
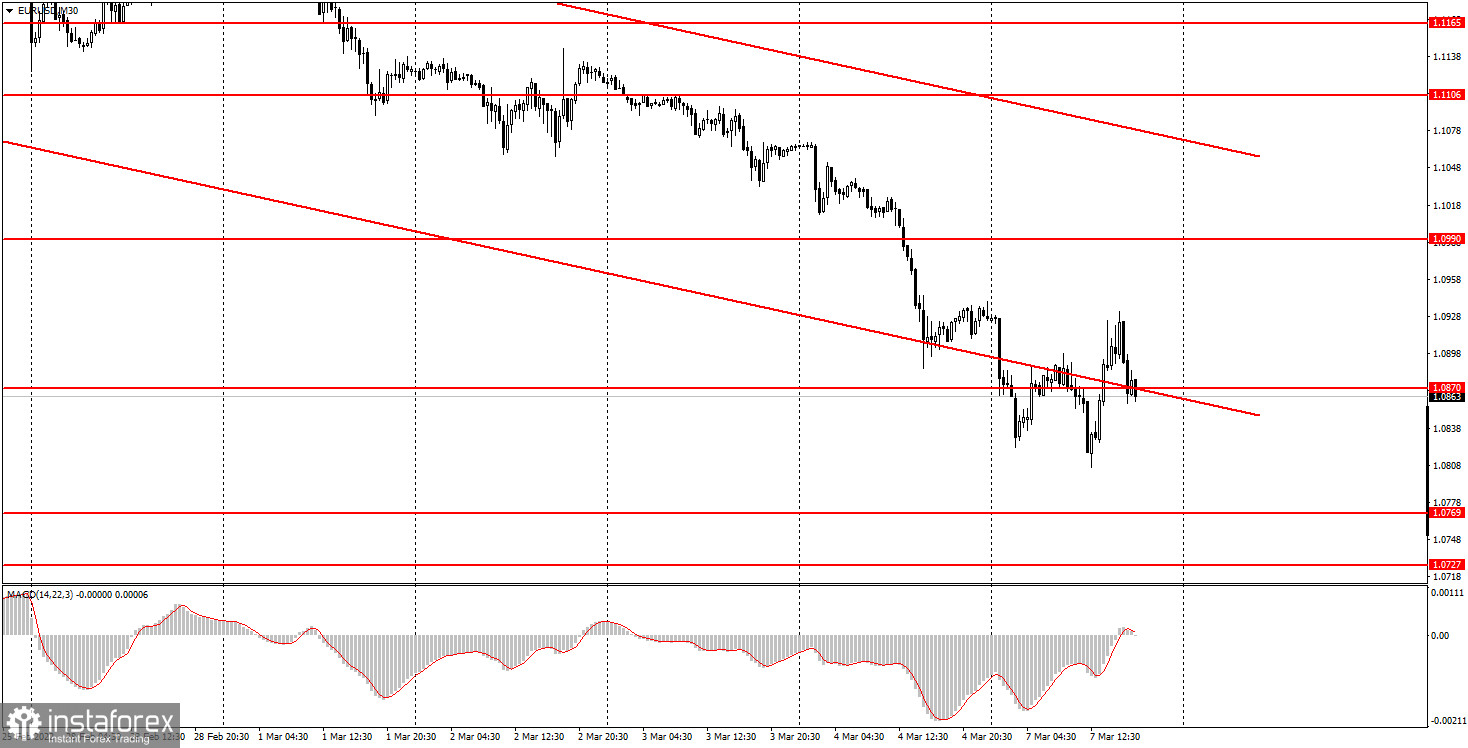
Volatility on EUR/USD remains high. All levels near the price are relatively formal because the pair approached them for the last time over a year ago. So, these are the levels of a year ago and older. The downtrend is visible to the naked eye, and the euro falls almost every day. On Monday, the price somewhat retraced up but resumed its slide by the end of the day. Important macroeconomic reports weren't published either in the European Union or the United States. There was no significant geopolitical news as well. So, there were absolutely no factors that could somehow boost the US dollar. Nevertheless, it seems that the euro/dollar pair will be in the downtrend for a long time.
M5 chart of EUR/USD
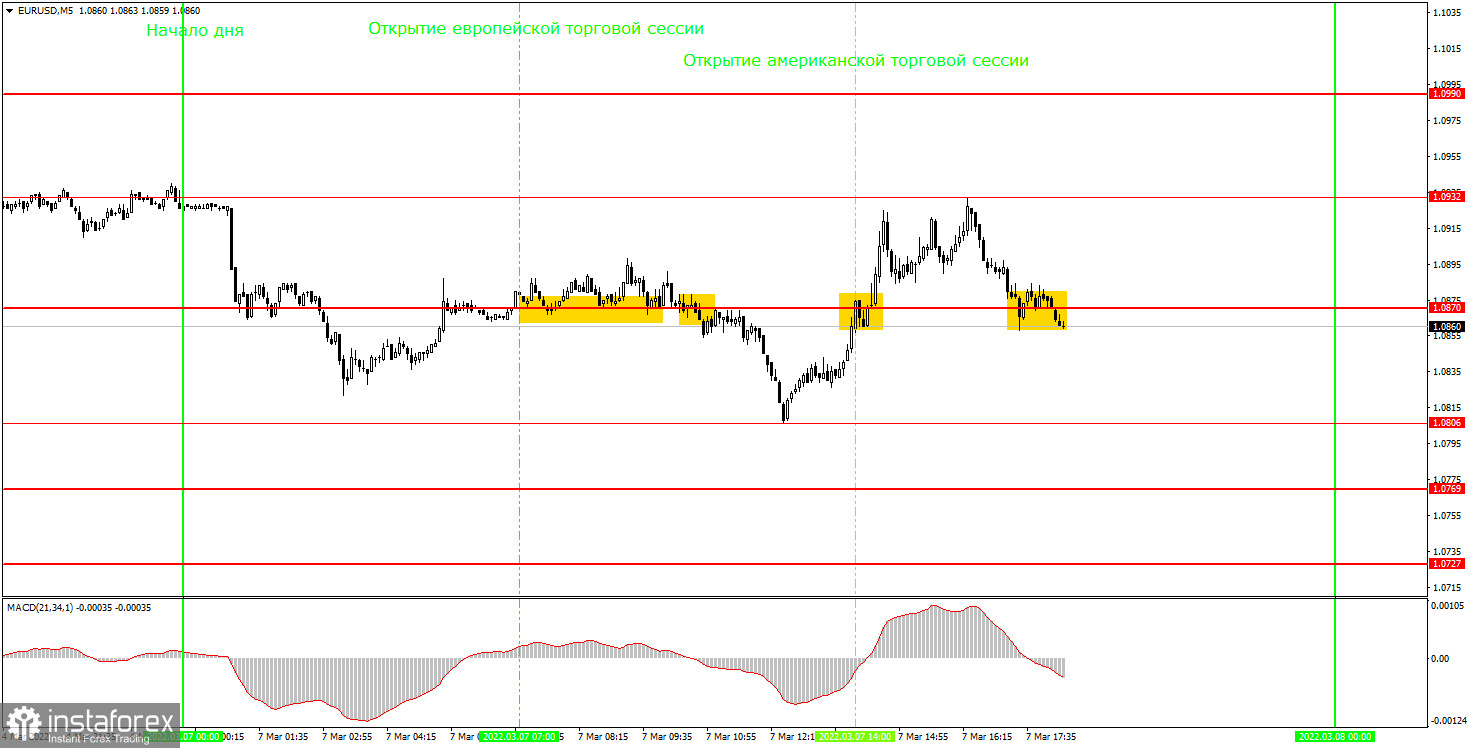
In the M5 time frame on Monday, the pair was mostly moving sideways or retracing up, but hit new lows at the end of the day. All trading signals were produced near 1.0870. On the chart above, you can also see the levels of 1.0806 and 1.0932 - Monday's low and high. They had nothing to do with Monday trading. So, let's get back to the trading signals. The pair retraced up from 1.0870 several times, and beginner traders were able to enter long positions. However, these buy signals were very weak. Therefore, after consolidation below 1.0870, the novice should have gone short. That signal turned out to be somewhat stronger as the pair went down by 48 pips. That is, traders had enough time to close their trades manually and receive a profit (the closest target level was located at a long distance). A new buy signal was generated after consolidation above 1.0870 and the pair rose by 30 pips, which was enough to place a stop-loss order at the breakeven point. The last trading signal emerged too late. So, there was no point in following it.
Trading plan for Tuesday:
In the 30M time frame, the downtrend continues. Therefore, it would be wise to expect the pair to go further down and enter just short positions, and not vice versa. If only the price fixes above the descending channel, long positions could be considered. In the meantime, the pair may retrace up several times due to the empty macroeconomic calendar at the beginning of the week. The target levels in the 5M time frame are seen at 1.0727, 1.0769, 1.0806, 1.0870, 1.0932, and 1.0990. A stop-loss order should be set at the breakeven point as soon as the price passes 15 pips in the right direction. On Tuesday, the third estimate of Q4 GDP in the eurozone will be published. It should come in line with the previous two estimates. Therefore, it is unlikely to have any influence on the market. In the United States, no important macroeconomic events are scheduled for release.
Basic principles of the trading system:
1) The strength of the signal depends on the time period during which the signal was formed (a rebound or a break). The shorter this period, the stronger the signal.
2) If two or more trades were opened at some level following false signals, i.e. those signals that did not lead the price to Take Profit level or the nearest target levels, then any consequent signals near this level should be ignored.
3) During the flat trend, any currency pair may form a lot of false signals or do not produce any signals at all. In any case, the flat trend is not the best condition for trading.
4) Trades are opened in the time period between the beginning of the European session and until the middle of the American one when all deals should be closed manually.
5) We can pay attention to the MACD signals in the 30M time frame only if there is good volatility and a definite trend confirmed by a trend line or a trend channel.
6) If two key levels are too close to each other (about 5-15 pips), then this is a support or resistance area.
How to interpret charts:
Support and resistance levels can serve as targets when buying or selling. You can place Take Profit near them.
Red lines are channels or trend lines that display the current trend and show which direction is better to trade.
MACD indicator (14,22,3) is a histogram and a signal line showing when it is better to enter the market when they cross. This indicator is better to be used in combination with trend channels or trend lines.
Important speeches and reports that are always reflected in the economic calendars can greatly influence the movement of a currency pair. Therefore, during such events, it is recommended to trade as carefully as possible or exit the market in order to avoid a sharp price reversal against the previous movement.
Beginner traders should remember that every trade cannot be profitable. The development of a reliable strategy and money management is the key to success in long-term trading.


