


Analysis of Wednesday's trades:
30M chart of GBP/USD
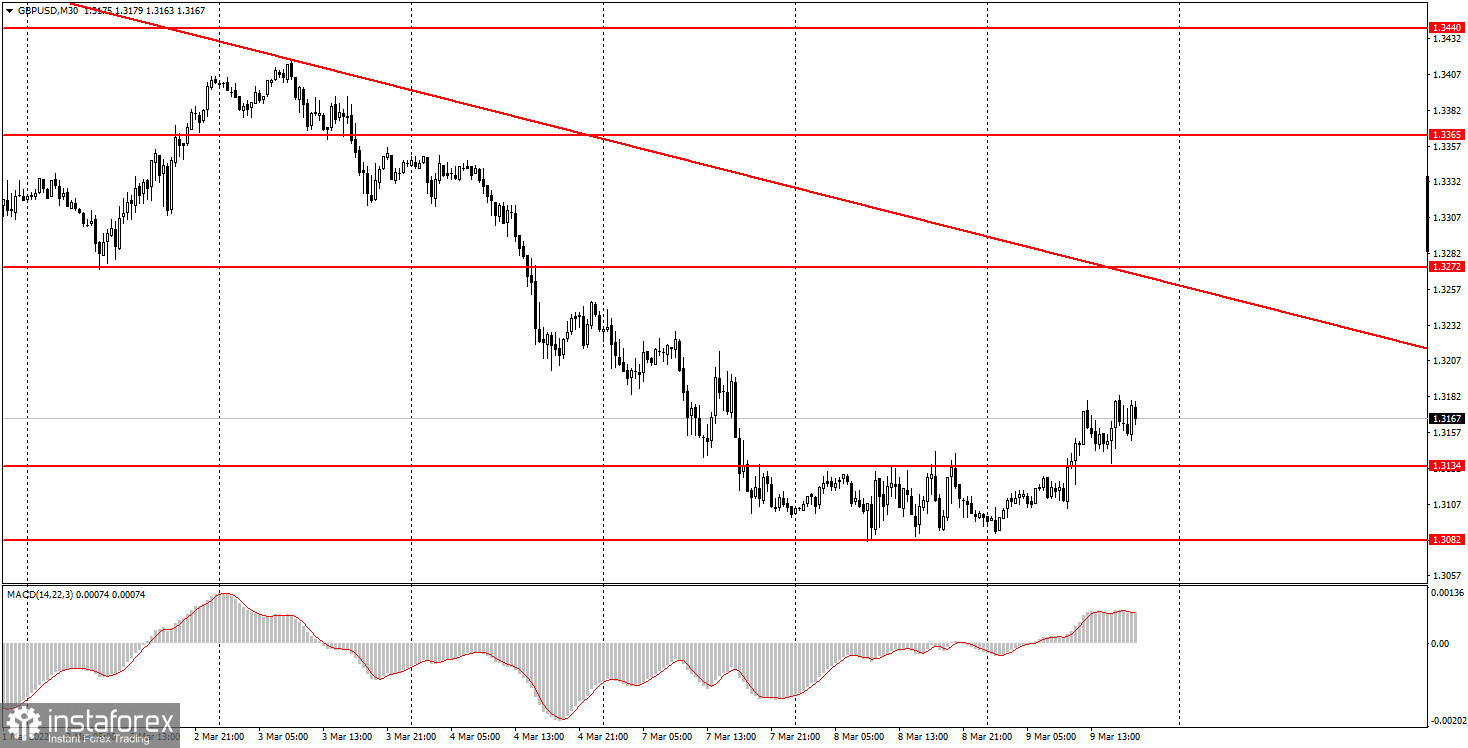
GBP/USD retraced up on Wednesday, but its volatility was much lower than that of EUR/USD. The price quickly left the 1.3082 - 1.3134 channel. Since it was a very narrow corridor, it was clear from the beginning that the pair would not stay in it for long. Traders were buying the instrument on Wednesday, but these purchases looked more like a minor correction. Therefore, the downtrend on the pound is highly likely to resume. Like in the case of EUR/USD, no important macro events unfolded during the day. However, the pair did not show a 200 pips move during the day either. In other words, this was a simple technical correction. Thursday will not be as important for GBP/USD as it will be for EUR/USD. The US inflation report and talks between Moscow and Kyiv are on the agenda. The pace of the pair's movement may speed up but its further direction is hard to foresee.
M5 chart of GBP/USD
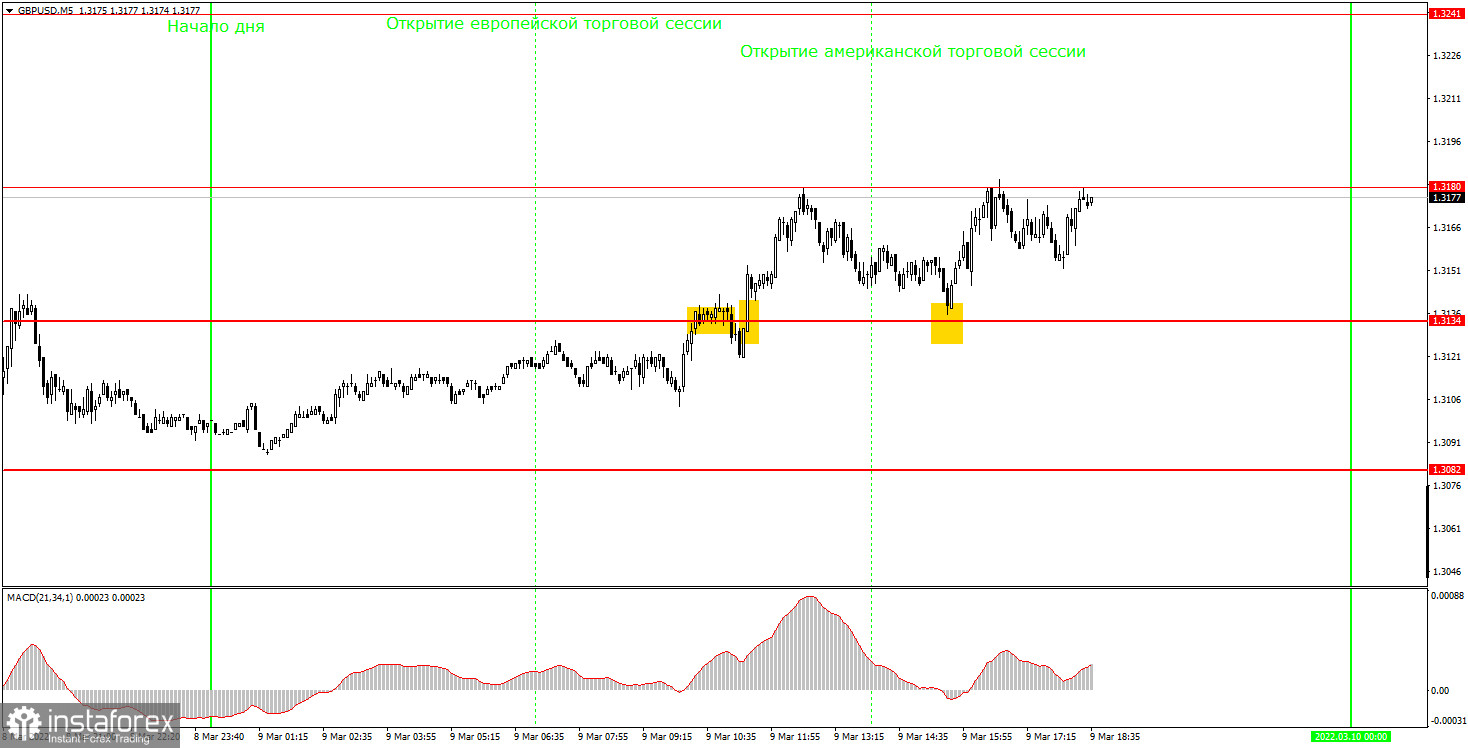
In the M5 time frame, all trading signals were produced at 1.3134. However, the market was not flat. The 1.3180 level – the new daily high – did not take part in Wednesday trading. Moreover, the price may update the high today in the event of a further increase. The first sell signal was made at 1.3134 when the quote rebounded from it. It turned out to be a false signal because the pair had failed to go down even by 10 pips. The following buy signal was stronger. If long positions were closed manually, the novice were able to make a profit. Since the price rose by 30 pips, there was such a chance. The second buy signal appeared at 1.3134. Although it was slightly inaccurate, trades could still be opened. After the signal had been produced, the quote grew by about 30 pips, and traders were able to make a 10-15 pips profit. The two profitable positions could offset the losses of one unprofitable trade. Unfortunately, yielding a higher profit was impossible on Wednesday due to low volatility and the pair's weaker movement.
Trading plan for Thursday:
In the 30M time frame, a bullish correction started. However, the bearish trend remains as the quote is retracing up very slowly. The trend line was drawn on the chart to provide better understanding. If the price consolidates above it, it will mark the end of the bearish trend. The target levels in the 5M time frame are seen at 1.3082, 1.3134, 1.3180, 1.3241, and 1.3272. A stop-loss order should be set at the breakeven point as soon as the price passes 20 pips in the right direction after a trade has been opened. Neither macro events nor fundamentals are expected in the United Kingdom on Thursday. In the United States, the inflation rate will be released. The figure is likely to grow further. It is hard to tell how investors will react to the results. The market has faced turbulence lately. Therefore, the reaction may be illogical.
Basic principles of the trading system:
1) The strength of the signal depends on the time period during which the signal was formed (a rebound or a break). The shorter this period, the stronger the signal.
2) If two or more trades were opened at some level following false signals, i.e. those signals that did not lead the price to Take Profit level or the nearest target levels, then any consequent signals near this level should be ignored.
3) During the flat trend, any currency pair may form a lot of false signals or do not produce any signals at all. In any case, the flat trend is not the best condition for trading.
4) Trades are opened in the time period between the beginning of the European session and until the middle of the American one when all deals should be closed manually.
5) We can pay attention to the MACD signals in the 30M time frame only if there is good volatility and a definite trend confirmed by a trend line or a trend channel.
6) If two key levels are too close to each other (about 5-15 pips), then this is a support or resistance area.
How to interpret charts:
Support and resistance levels can serve as targets when buying or selling. You can place Take Profit near them.
Red lines are channels or trend lines that display the current trend and show which direction is better to trade.
MACD indicator (14,22,3) is a histogram and a signal line showing when it is better to enter the market when they cross. This indicator is better to be used in combination with trend channels or trend lines.
Important speeches and reports that are always reflected in the economic calendars can greatly influence the movement of a currency pair. Therefore, during such events, it is recommended to trade as carefully as possible or exit the market in order to avoid a sharp price reversal against the previous movement.
Beginner traders should remember that every trade cannot be profitable. The development of a reliable strategy and money management is the key to success in long-term trading.


