Analysis of Friday's deals:
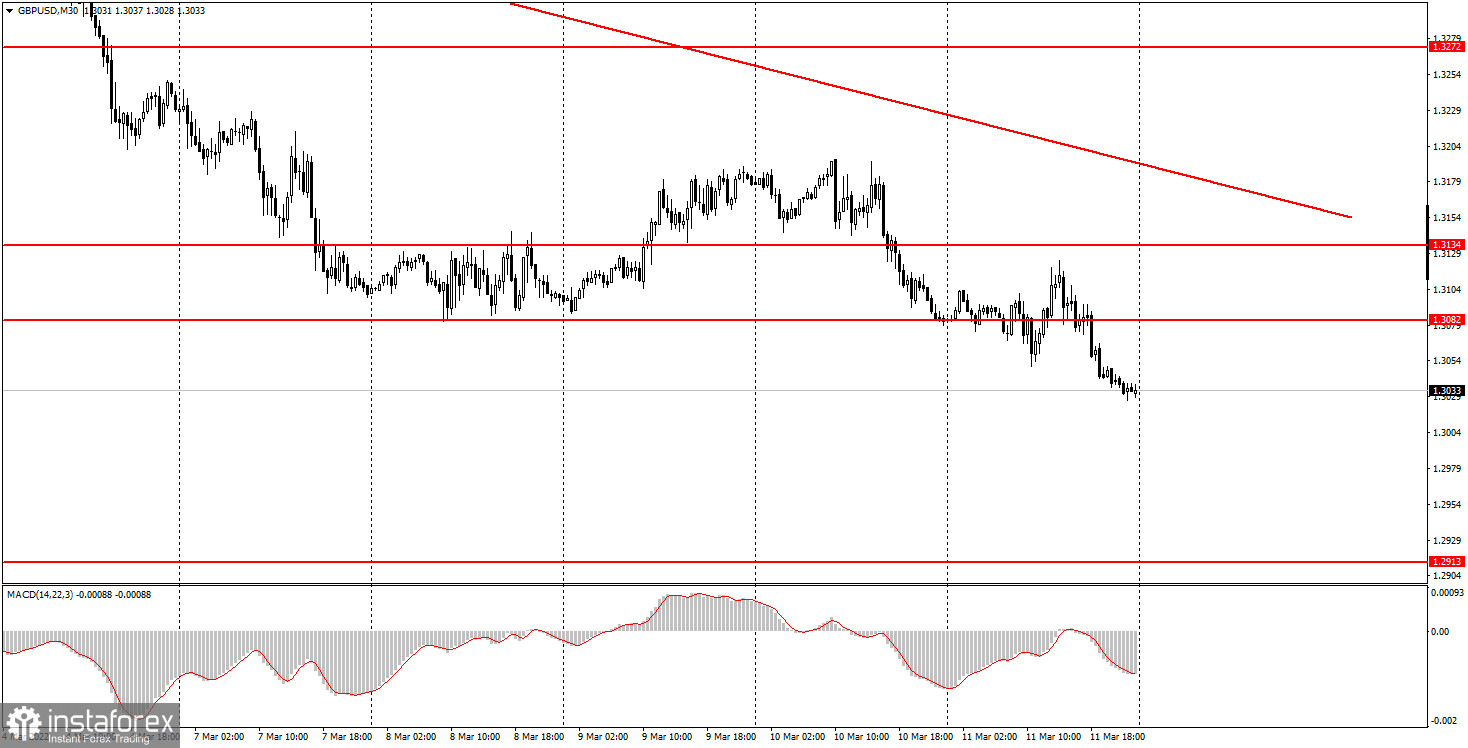
30M chart of the GBP/USD pair.

The GBP/USD pair on Friday, as well as the EUR/USD pair, moved very inconveniently for traders. It seems that initially the market was set up for a new round of purchases of the US currency, but in the middle of the day, something happened that led to a pullback upward. Perhaps it was the entry of a major player into the market. Perhaps it was important information not available to the masses. Anyway, in the middle of the day, there was a pullback of 70 points up, which spoiled the whole picture. At the same time, the downward trend persists, with very few levels below the current price values, because the price has not been so low for a very long time. However, as we have already said, now a lot in the foreign exchange market depends on geopolitics. Since the situation in Ukraine is not improving and threatens to only worsen every day, it is not surprising that the market continues to get rid of the most risky assets and transfer its funds into dollars. Therefore, we believe that the US currency has excellent chances to continue strengthening in pairs with the euro and the pound.
5M chart of the GBP/USD pair.
On the 5-minute timeframe, Friday's technical picture is even worse than for the euro/dollar. All trading signals of the day were formed around the same level of 1.3082. 7 signals. This indicates a flat, but still, looking at the movement on Friday, it can hardly be said that it was flat. Nevertheless, it was quite difficult to trade in such conditions, but at the same time, we remind you that every day the pair cannot move as traders would like and form exceptionally strong signals. It remains only to understand how to trade on Friday. Unfortunately, the picture here is worse than for the euro/dollar pair. The first two signals did not lead to a move in the right direction even by 20 points, so newcomers could get a loss on both trades. Fortunately, a small one. All the next five signals near the 1.3082 level should have been ignored since, at the time of their formation, at least two unprofitable trades had already been made. There were simply no signals near other levels.
How to trade on Monday:
On the 30-minute TF, the pair continues to trade with a decrease and the downward trend is already quite strong and long. And we don't see any reason why it can't continue for a few more weeks. Although, of course, sooner or later it will end. But its completion can be identified at least by fixing the price above the trend line. In the meantime, the price doesn't even come close to this line. On the 5-minute TF tomorrow, it is recommended to trade at the levels of 1.2913, 1.3082, 1.3124-1.3134. When the price passes after opening a deal in the right direction, 20 points should be set to Stop Loss at breakeven. There are no important events or publications scheduled for tomorrow in the UK and the USA. If the pair continues to fall during the day, then there are simply no levels below (the level of 1.2913 is far enough). You can try to use Friday's minimum of 1.3026, but it is not extreme and is rather doubtful. You need to be prepared for the fact that there will be few signals tomorrow, and you will need to close trades manually.
Basic rules of the trading system:
1) The strength of the signal is calculated by the time it took to generate the signal (rebound or overcoming the level). The less time it took, the stronger the signal.
2) If two or more trades were opened near a certain level on false signals, then all subsequent signals from this level should be ignored.
3) In a flat, any pair can form a lot of false signals or not form them at all. But in any case, at the first signs of a flat, it is better to stop trading.
4) Trade transactions are opened in the period between the beginning of the European session and the middle of the American session when all transactions must be closed manually.
5) On a 30-minute TF, signals from the MACD indicator can be traded only if there is good volatility and a trend, which is confirmed by a trend line or a trend channel.
6) If two levels are located too close to each other (from 5 to 15 points), then they should be considered as a support or resistance area.
What's on the chart:
Price support and resistance levels - the levels that are the targets when opening purchases or sales. Take Profit levels can be placed near them.
Red lines - channels or trend lines that display the current trend and show in which direction it is preferable to trade now.
MACD indicator (14, 22, 3) is a histogram and a signal line - an auxiliary indicator that can also be used as a signal source.
Important speeches and reports (always contained in the news calendar) can greatly influence the movement of a currency pair. Therefore, during their exit, it is recommended to trade as carefully as possible or exit the market to avoid a sharp price reversal against the previous movement.
Beginners to trade in the forex market should remember that every transaction cannot be profitable. Developing a clear strategy and money management is the key to success in trading for a long period.


