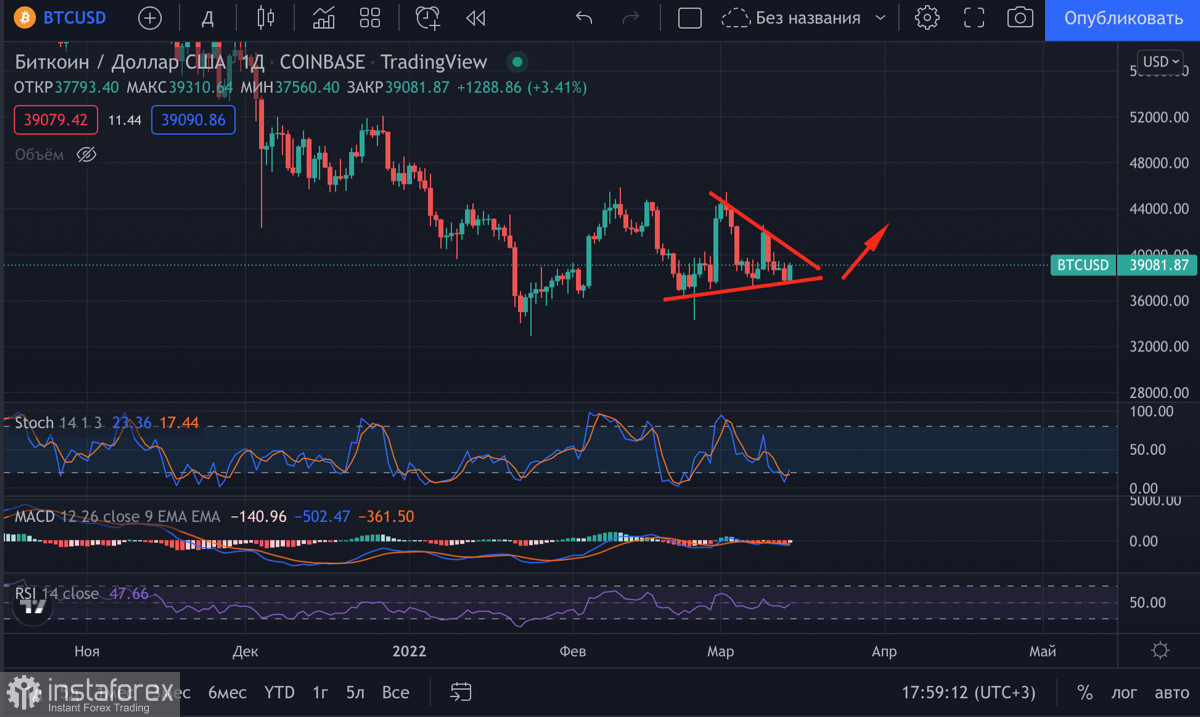
Over the past three weeks, BTC has hit the swing low in the range of $32K-$35K twice. During this time, the price, being in the accumulation stage, constantly updated the low. On the daily chart, the formation of the triangle pattern is nearing completion. There is every reason to believe that the price will reach the bottom for the third time shortly and the uptrend will resume.
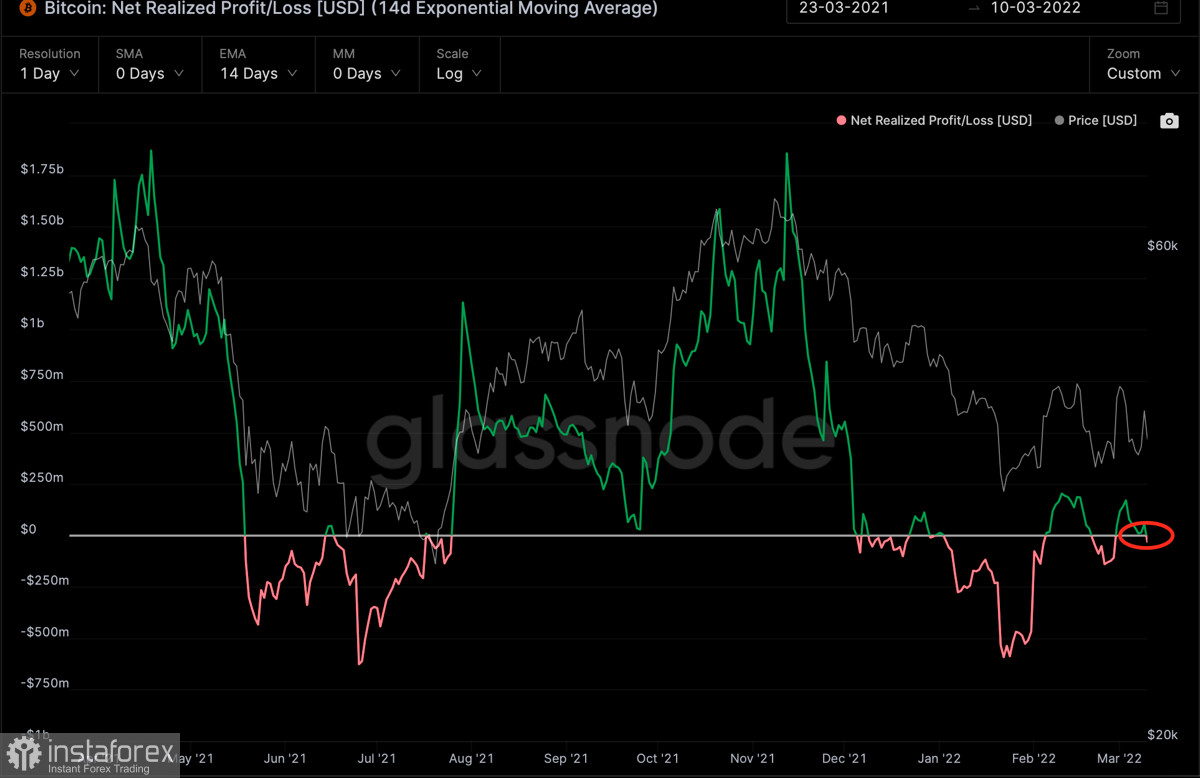
The profit and loss on-chain metrics show such a possibility as the indicator now has a value of 1, which means losses almost equal profits. Previously, bitcoin twice hit swing support when the value of the indicator fell to or below 1.

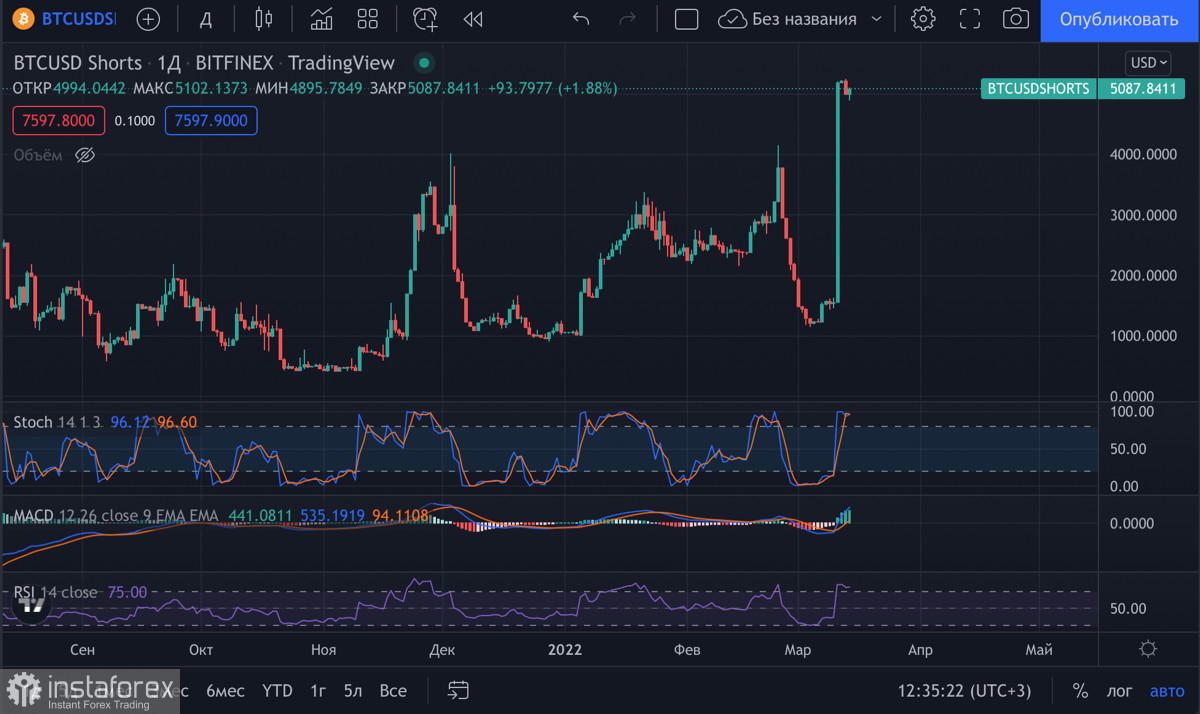
In addition, the number of bulls and bears in the market is relatively the same. Moreover, there have been no spontaneous or impulsive sell-offs. Under such circumstances, the ratio of long and short positions requires special attention. On March 13, the number of short positions increased sharply. The rise could be the result of market makers' impact as the volume grew almost instantly.

History shows that the price always moves against the crowd. Therefore, bitcoin might leave the range and go up, while sellers might collect liquidity. There are two important factors in favor of such an outcome. Firstly, this is the tirange pattern as the basis for an impulse breakout. Secondly, this is also the bullish engulfing pattern as the reason why the price will ascend. Technical indicators confirm the bullish scenario as well. The Stochastic and the RSI are showing an increase in the number of long positions, thus confirming the end of the accumulation stage.

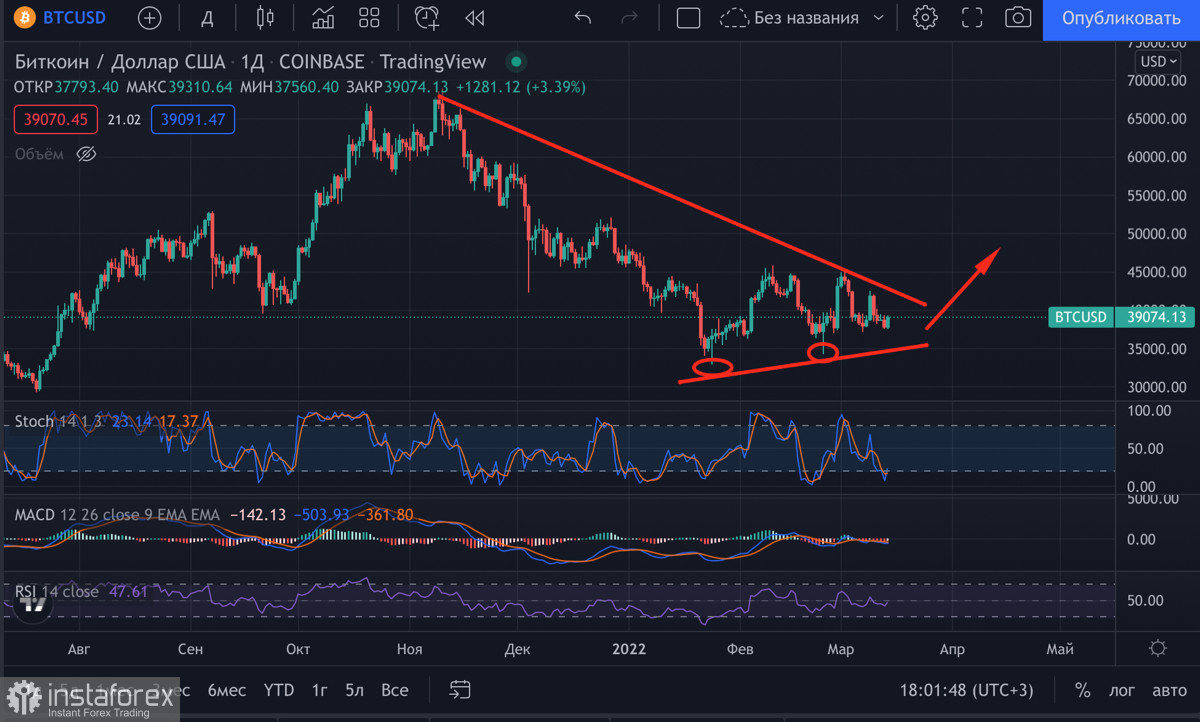
In a broader perspective, there is another triangle pattern with swing low support. With this in mind, we can assume that BTC/USD hit the new low in the $37.1K-$37.4K range. If bitcoin breaks through $44K and goes up this week, the price will be able to leave the wide range of $32K-$45K. Otherwise, the pair may rally when market makers start to collect liquidity in the $32K-$45K range.


