EUR/USD 5M

The EUR/USD pair was adjusted during the first trading day of the week. This was not the most obvious scenario, although the price often likes to adjust on Mondays. Especially when there are no important macroeconomic events. Volatility for the pair remained high, much higher than for the pound, although the latter has always been and is a more volatile currency. Thus, it can be assumed that the trading volumes for the euro currency are much higher now. However, there is nothing surprising here, since the euro is still a much more widespread currency than the pound. The main thing is that the Federal Reserve will hold a meeting this Wednesday, at which the rate will be raised almost one hundred percent. The only question is, by 0.25% or by 0.50%. Depending on this, the pair will be traded on Wednesday or maybe even in advance, on Tuesday. The decision to raise the rate by 0.25% may disappoint dollar bulls.
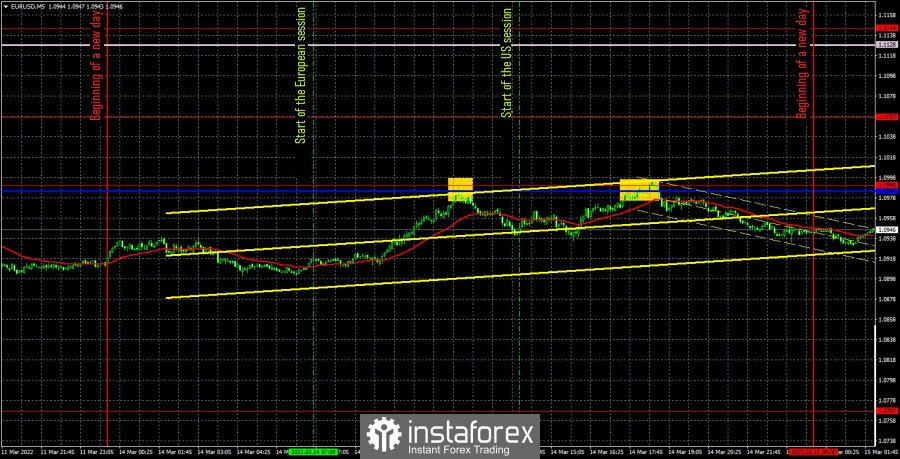
As for trading signals, there were only two of them during the past day. In the middle of the European session, the pair rebounded from the extreme level of 1.0990, and at the same time from the critical line. After this signal, the pair managed to go down only 30 points. Thus, traders formally could have time to close this short position in profit. Anyway, the nearest target level is too far away, so the deal should have been closed manually in any case. The second signal near the 1.0990 level was formed too late, so it should not have been worked out in any case.
COT report:

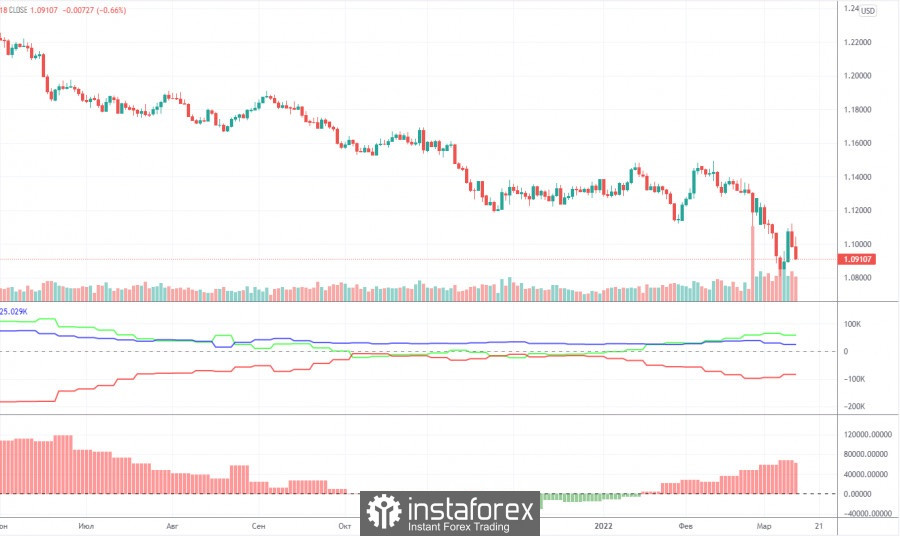
The new Commitment of Traders (COT) report, which was released on Friday, showed a weakening of the "bullish" mood among professional traders. The first weakening in the last few months. We have already drawn the attention of traders to the fact that major players were actively building up long positions, but at the same time the euro was falling and continues to do so. This time, the "non-commercial" group has opened about 15,000 long positions and 20,500 short positions. Thus, the net position decreased by 5,500. Despite this decrease, the overall mood remains bullish, and the trend is downward. The problem is that the demand among major players for the euro currency may be growing, but at the same time the demand for the US currency is also growing and at a much higher rate. Therefore, we are now dealing not with a classic market situation, when the demand for one currency is growing and the second is declining, but with a situation where the demand is growing for both currencies, but one of them is much faster and stronger. From our point of view, this explains the growth of the dollar in recent weeks on all fronts. Thus, now the data of the COT reports simply do not coincide with what is actually happening with the euro/dollar pair. Therefore, it is impossible to make a forecast for the pair based on COT reports.
We recommend to familiarize yourself with:
Overview of the EUR/USD pair. March 15. The conflict between Ukraine and the Russian Federation persists. It is still difficult for the euro currency to grow.
Overview of the GBP/USD pair. March 15. Two meetings of central banks. What to expect?
Forecast and trading signals for GBP/USD on March 15. Detailed analysis of the movement of the pair and trading transactions.
EUR/USD 1H

Explanations for the chart:
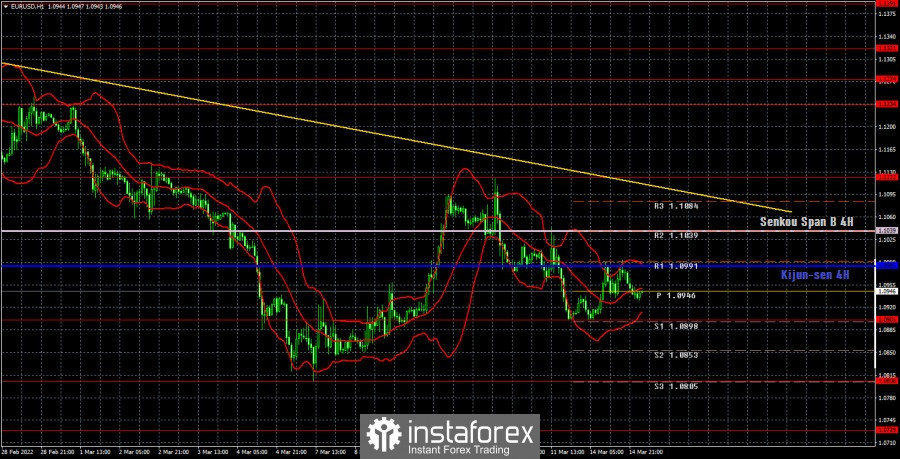
Support and Resistance Levels are the levels that serve as targets when buying or selling the pair. You can place Take Profit near these levels.
Kijun-sen and Senkou Span B lines are lines of the Ichimoku indicator transferred to the hourly timeframe from the 4-hour one.
Support and resistance areas are areas from which the price has repeatedly rebounded off.
Yellow lines are trend lines, trend channels and any other technical patterns.
Indicator 1 on the COT charts is the size of the net position of each category of traders.
Indicator 2 on the COT charts is the size of the net position for the non-commercial group.


