


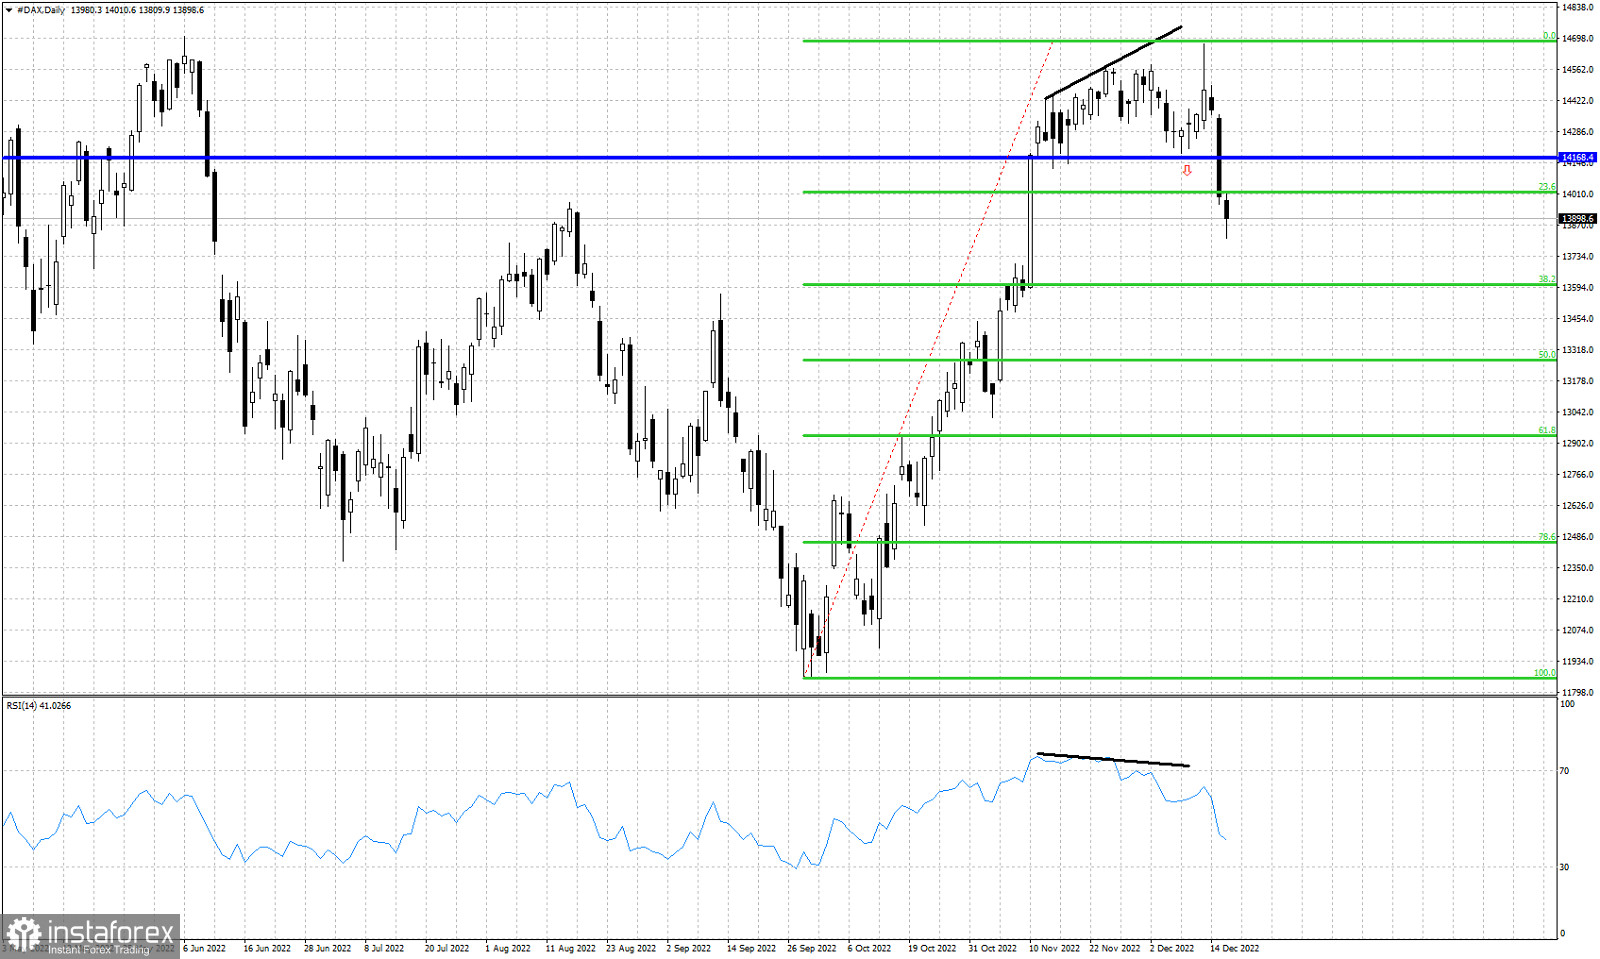
Black lines- bearish divergence
blue line- support
Green lines- Fibonacci retracements
In our previous analysis we warned traders that a break below $14,160-70 would be a bearish sign. Combined with the fact that the RSI has been providing bearish divergence warnings, we had a bearish mix of signals with increased chances of a reversal. Yesterday Dax index broke below the blue horizontal support level. Price has surpassed the 23.6% Fibonacci retracement and is heading towards the next at the 38%. Short-term trend has changed to bearish from bullish. DAX is vulnerable to a pull back towards the 50% and 61.8% Fibonacci levels. Resistance is at $14,500 and as long as we trade below this level, we expect price to continue lower.


