EUR/USD 5M

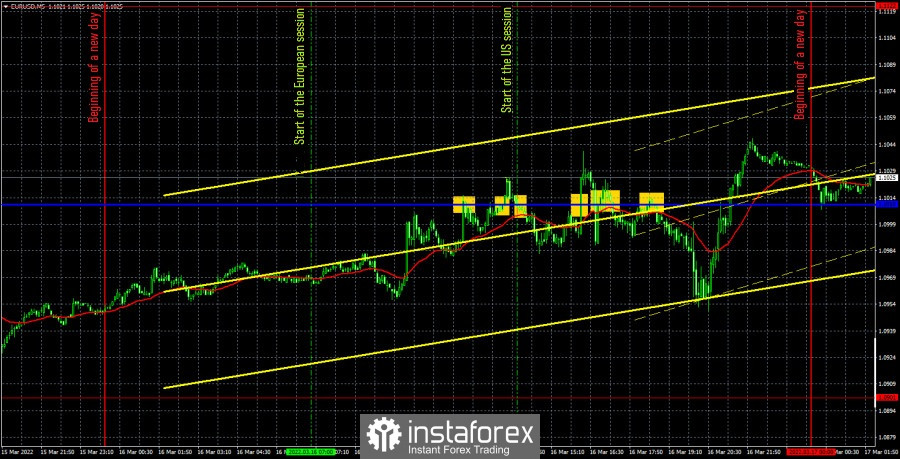
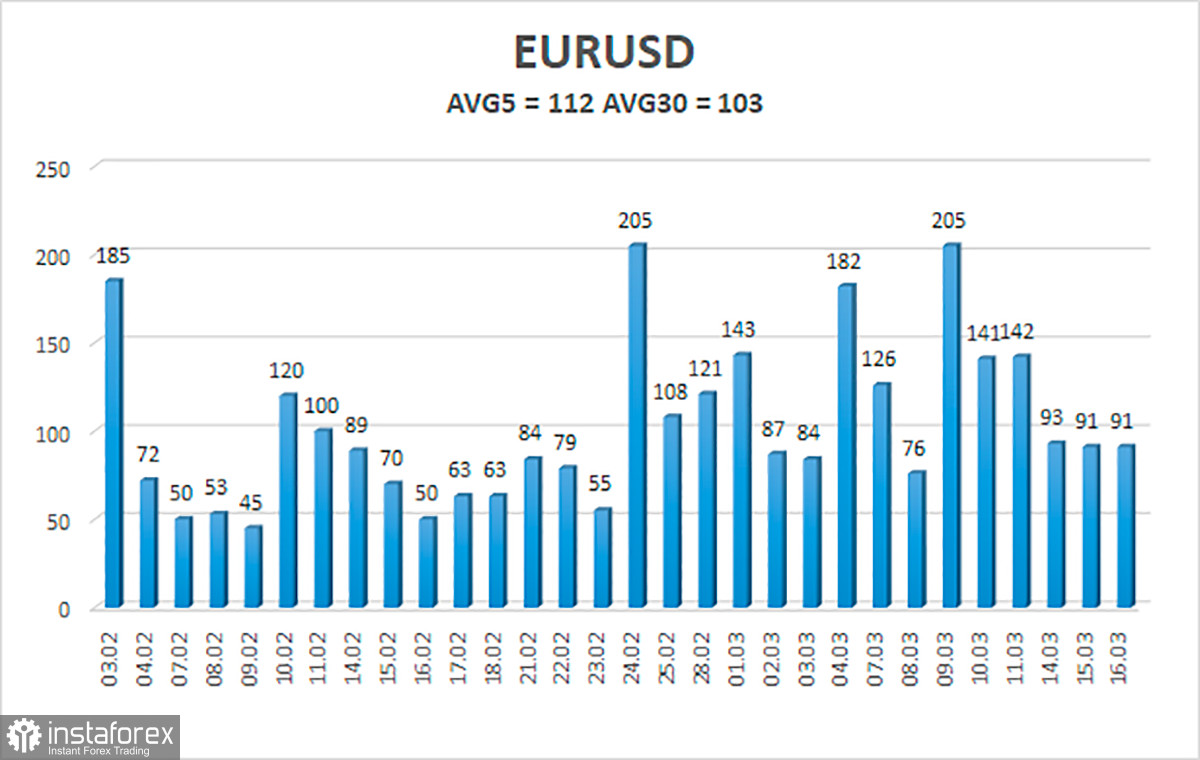
Yesterday, the EUR/USD pair was adjusted for most of the day. We cannot say that the movement was weak, since the volatility before summing up the results of the Federal Reserve meeting was 90 points. However, 90 points is not so much based on what we have witnessed in recent weeks. In general, the pair was correcting, and the closer the X hour was, the more nervous the market became. This is perfectly noticeable by the movements of the pair in the US trading session, when the "swing" mode turned on. No one even paid attention to the report on retail sales in the US. Well, in the evening it became known that the Fed decided to raise the key rate by 0.25%. Let me remind you that the second option was an increase of 0.50%, but the Fed decided not to take risks at such a difficult time from a geopolitical point of view and chose the option that suits everyone as much as possible. As a result, after the results of the meeting became known, the US dollar first rose by 40 points, and then fell by 50. Thus, the reaction can be called weak. The rate increase of 0.25% was not unexpected for the markets.
As for trading signals, all of them were formed during the day only near one Kijun-sen line. And their accuracy left much to be desired. In principle, it was possible to try to work out only the first two signals, which, of course, turned out to be false. First, the pair bounced off the critical line (a sell signal), and then overcame it (a buy signal). In both cases, the pair failed to go in the right direction by even 15 points. Thus, a loss was received on both transactions. All further signals should not have been worked out.
COT report:

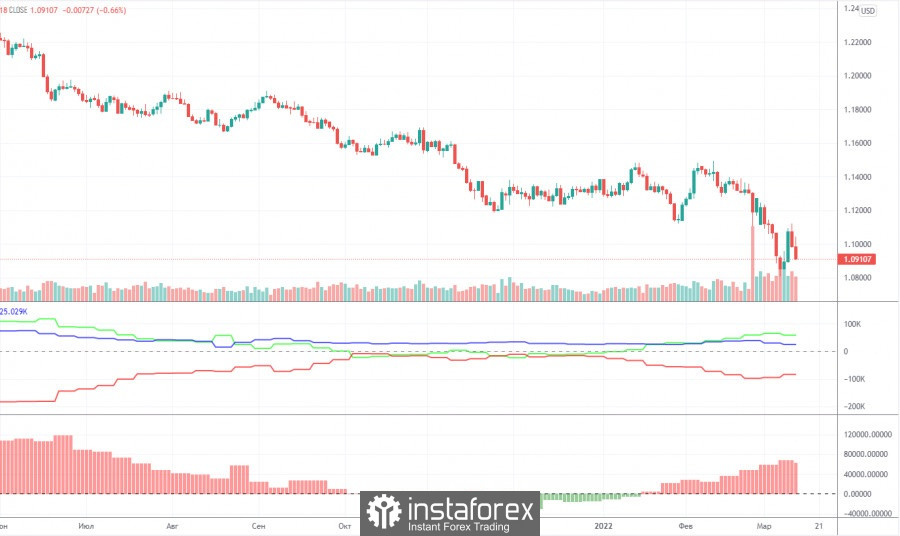
The new Commitment of Traders (COT) report, which was released on Friday, showed a weakening of the "bullish" mood among professional traders. The first weakening in the last few months. We have already drawn the attention of traders to the fact that major players were actively building up long positions, but at the same time the euro was falling and continues to do so. This time, the "non-commercial" group has opened about 15,000 long positions and 20,500 short positions. Thus, the net position decreased by 5,500. Despite this decrease, the overall mood remains bullish, and the trend is downward. The problem is that the demand among major players for the euro currency may be growing, but at the same time the demand for the US currency is also growing and at a much higher rate. Therefore, we are now dealing not with a classic market situation, when the demand for one currency is growing and the second is declining, but with a situation where the demand is growing for both currencies, but one of them is much faster and stronger. From our point of view, this explains the growth of the dollar in recent weeks on all fronts. Thus, now the data of the COT reports simply do not coincide with what is actually happening with the euro/dollar pair. Therefore, it is impossible to make a forecast for the pair based on COT reports.
We recommend to familiarize yourself with:
Overview of the EUR/USD pair. March 17. Kiev and Moscow have finally begun to approach a peace agreement.
Overview of the GBP/USD pair. March 17. Reuters believes that the Bank of England will not stop at 1% of the key rate.
Forecast and trading signals for GBP/USD on March 17. Detailed analysis of the movement of the pair and trading transactions.
EUR/USD 1H

Movements during the day were as calm as possible on the hourly timeframe, and when the results of the Fed meeting became known, almost nothing changed. The volatility of the pair in the first hours after the announcement of the results did not even exceed 50 points. And this is very little, considering that now the pair each passes at least 80-90 points. However, today is still ahead and we still have the Europeans' reaction to the results of the meeting. On Thursday, we allocate the following levels for trading - 1.0729, 1.0806, 1.0901, 1.1122, as well as the Senkou Span B (1.1018) and Kijun-sen (1.1010) lines. There are also support and resistance levels, but no signals will be formed near them. The lines of the Ichimoku indicator may change their position during the day, which should be taken into account when searching for trading signals. Signals can be "bounces" and "breakthrough" levels - extremes and lines. Do not forget about placing a Stop Loss order at breakeven if the price went in the right direction of 15 points. This will protect you against possible losses if the signal turns out to be false. No important events or publications planned in the European Union on March 17. There is only a report on industrial production in the US, which is unlikely to interest anyone. However, sharp reversals may be observed in the Asian and European trading sessions, as the market will continue to work out the results of the Fed meeting.
Explanations for the chart:
Support and Resistance Levels are the levels that serve as targets when buying or selling the pair. You can place Take Profit near these levels.
Kijun-sen and Senkou Span B lines are lines of the Ichimoku indicator transferred to the hourly timeframe from the 4-hour one.
Support and resistance areas are areas from which the price has repeatedly rebounded off.
Yellow lines are trend lines, trend channels and any other technical patterns.
Indicator 1 on the COT charts is the size of the net position of each category of traders.
Indicator 2 on the COT charts is the size of the net position for the non-commercial group.


