GBP/USD 5M

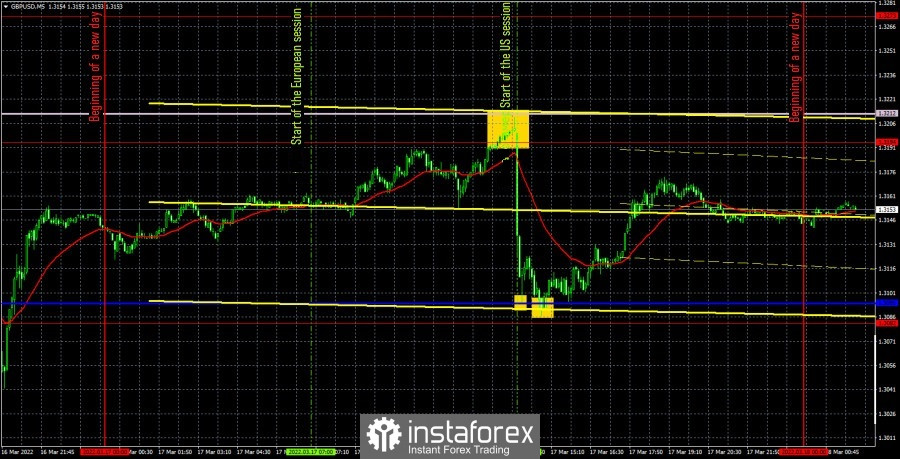
The GBP/USD currency pair on Thursday produced such movements that probably no one could predict. In a very short period of time, the pair collapsed by 120 points immediately after the announcement of the results of the Bank of England meeting, which raised the key rate by 0.25%. After that, a slightly less rapid recovery of the British currency began and by the evening most of the losses were recovered. That is, it turns out that the market did not continue the seemingly started new downward trend, but at the same time its reaction to the results of the BoE meeting is absolutely incomprehensible. Recall that any rate increase is a tightening of monetary policy, which, logically, should cause a strengthening of the currency. But this did not happen on Thursday, which once again proves the fact that the market does not always react to the "foundation" or "macroeconomics" as traders assume. This is because there are also large players on the market, who often work according to their own logic.
As for trading signals, there were only three of them during the past day. First, the pair rose to the area from the level of 1.3194 and the Senkou Span B line and bounced off both in total. However, there was no way to "catch" this signal, as the pair almost instantly collapsed down. Also, it was at this time that the results of the BoE meeting were summed up, so it was simply not necessary to risk opening deals. Moreover, the results of the meeting spoke in favor of the pound's further growth, and not its fall. But the signals in the form of bounces from the critical line could be worked out. They were quite accurate and after an absolutely illogical fall in the pound, one could count on at least a small increase. As a result, by the evening, when it was necessary to manually close all transactions, the pair went up about 50 points. That's how much you could earn on a long position.
COT report:

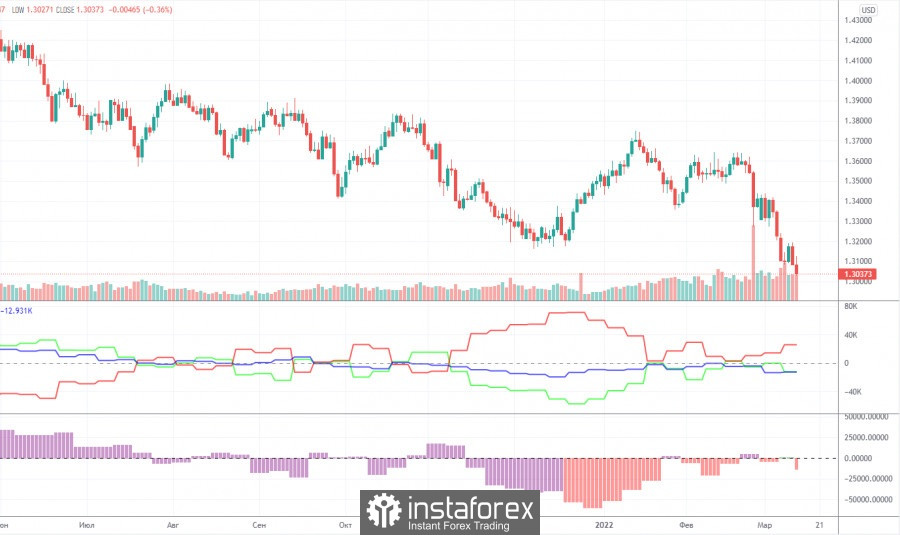
The latest Commitment of Traders (COT) report on the British pound showed an increase in the "bearish" mood among professional traders. However, in general, the mood of major players has changed too often in recent months, which is clearly seen by the two indicators in the chart above. At the moment, the number of open long positions is less than the number of short positions by 13,000. Although a week ago their numbers were almost the same. We can conclude that the major players cannot make a decision on exactly how to trade the pound. Of course, with the beginning of the military operation in Ukraine, a lot has changed for traders and investors. There was outright panic in the markets for several days. But even now, when enough time has passed to calm down, the markets are still in an excited state. In addition, strong demand for the US dollar also affects the movement of the pound/dollar pair, so COT reports do not always reflect what is actually happening in the market. Although the reports on the British pound are at least a little consistent. The green line of the first indicator (the net position of the "non-commercial" group) indicates that the major players are starting to look at the short positions on the British pound again. And since this line is not far from the zero mark, the pound has a lot to go down. In general, now most factors speak in favor of the growth of the US currency and COT reports are just one of them. At this time, geopolitics is the most important factor.
We recommend you familiarize yourself with:
Overview of the EUR/USD pair. March 18. The Fed did not surprise with its decisions and announcements. Traders reacted ambiguously.
Overview of the GBP/USD pair. March 18. The Bank of England raised its key rate by 0.25% following the Fed.
Forecast and trading signals for EUR/USD on March 18. Detailed analysis of the movement of the pair and trading transactions.
GBP/USD 1H

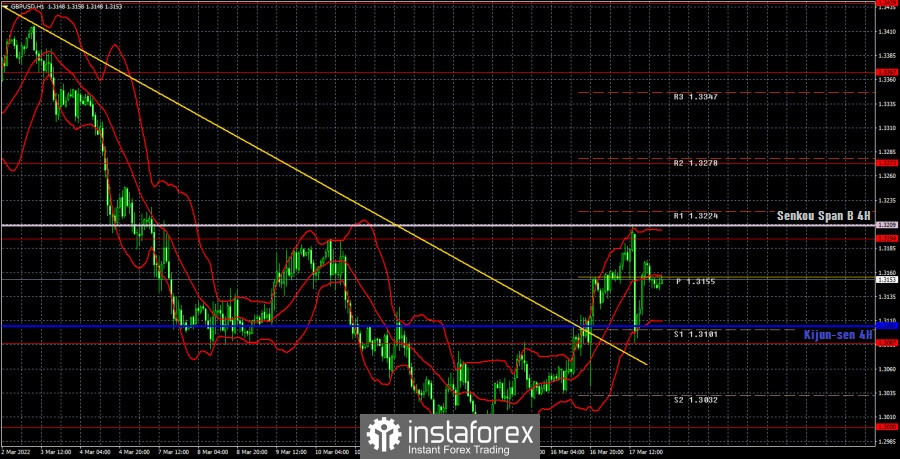
The price has settled above the descending trend line on the hourly timeframe, but in the current circumstances, this absolutely does not mean that a new upward trend will now be formed. Over the past two days, two meetings of central banks have taken place at once, so there is no doubt that the market was impressed by these events. However, we draw your attention to the fact that the 1.3194 level remained unsettled and this is the second price rebound from it. On March 18, we highlight the following important levels: 1.3000, 1.3087, 1.3194, 1.3273. The Senkou Span B (1.3209) and Kijun-sen (1.3105) lines can also be signal sources. Signals can be "bounces" and "breakthroughs" of these levels and lines. It is recommended to set the Stop Loss level to breakeven when the price passes in the right direction by 20 points. The lines of the Ichimoku indicator can move during the day, which should be taken into account when determining trading signals. There are also support and resistance levels on the chart that can be used to take profits on transactions. No major events scheduled for Friday in the UK and the US. There have already been a lot of events this week, so today we expect a decrease in volatility and a new test of the 1.3194 level. Overcoming it will show the mood of traders for the coming week.
Explanations for the chart:
Support and Resistance Levels are the levels that serve as targets when buying or selling the pair. You can place Take Profit near these levels.
Kijun-sen and Senkou Span B lines are lines of the Ichimoku indicator transferred to the hourly timeframe from the 4-hour one.
Support and resistance areas are areas from which the price has repeatedly rebounded off.
Yellow lines are trend lines, trend channels and any other technical patterns.
Indicator 1 on the COT charts is the size of the net position of each category of traders.
Indicator 2 on the COT charts is the size of the net position for the non-commercial group.


