Details of the economic calendar of March 17:
Inflation in the European Union continues to update historical highs. Consumer prices in February 2022 increased by 5.9% compared to the same month in 2021. Against this background, there is information that the regulator intends to curtail the QE program at the end of July, and also, possibly, will raise the interest rate twice this year.
Due to these comments, the euro received support in the market.
In turn, the Bank of England is not wasting time and once again raises the interest rate to 0.75%. As stated in the message of the regulator, the measures are aimed at combating inflation in the UK. The BoE did not rule out the possibility of further rate hikes.
At the time of the announcement of the results of the meeting, the pound sterling sharply loses its value, which seems illogical in view of the rate increase. The reason for such an ambiguous movement lies in the comments of the regulator, which gives a forecast for inflation growth in April of 7.25%. On top of that, the Bank of England assumes that it will take at least 2 years for consumer prices to normalize at the level of 2%.
Analysis of trading charts from March 17
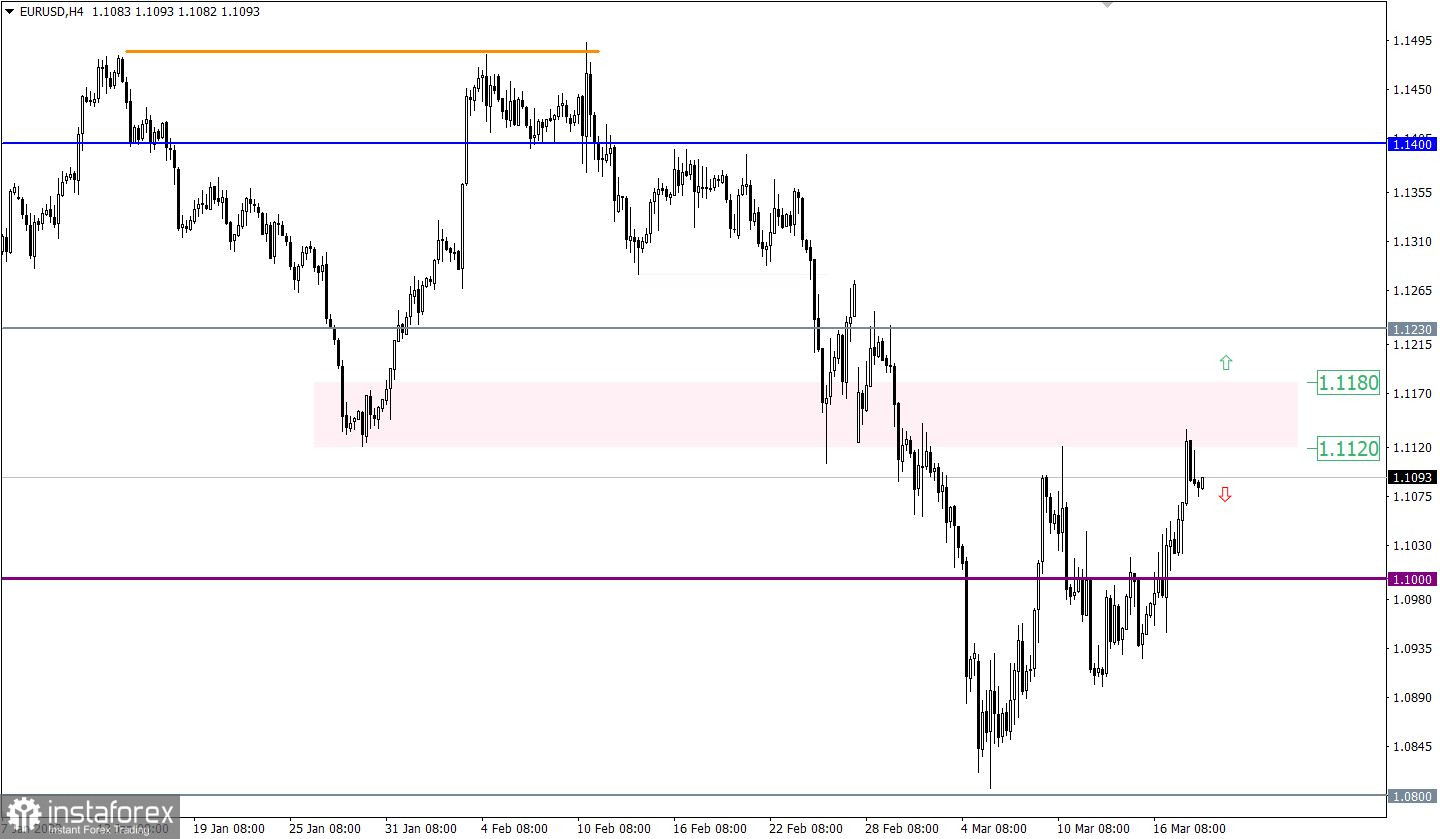
The EURUSD currency pair managed to prolong the corrective move previously set on the market. As a result, the local maximum of the past week was updated. Despite the desire of buyers to continue the formation of the upward move, the area of resistance 1.1120/1.1180 was not broken.
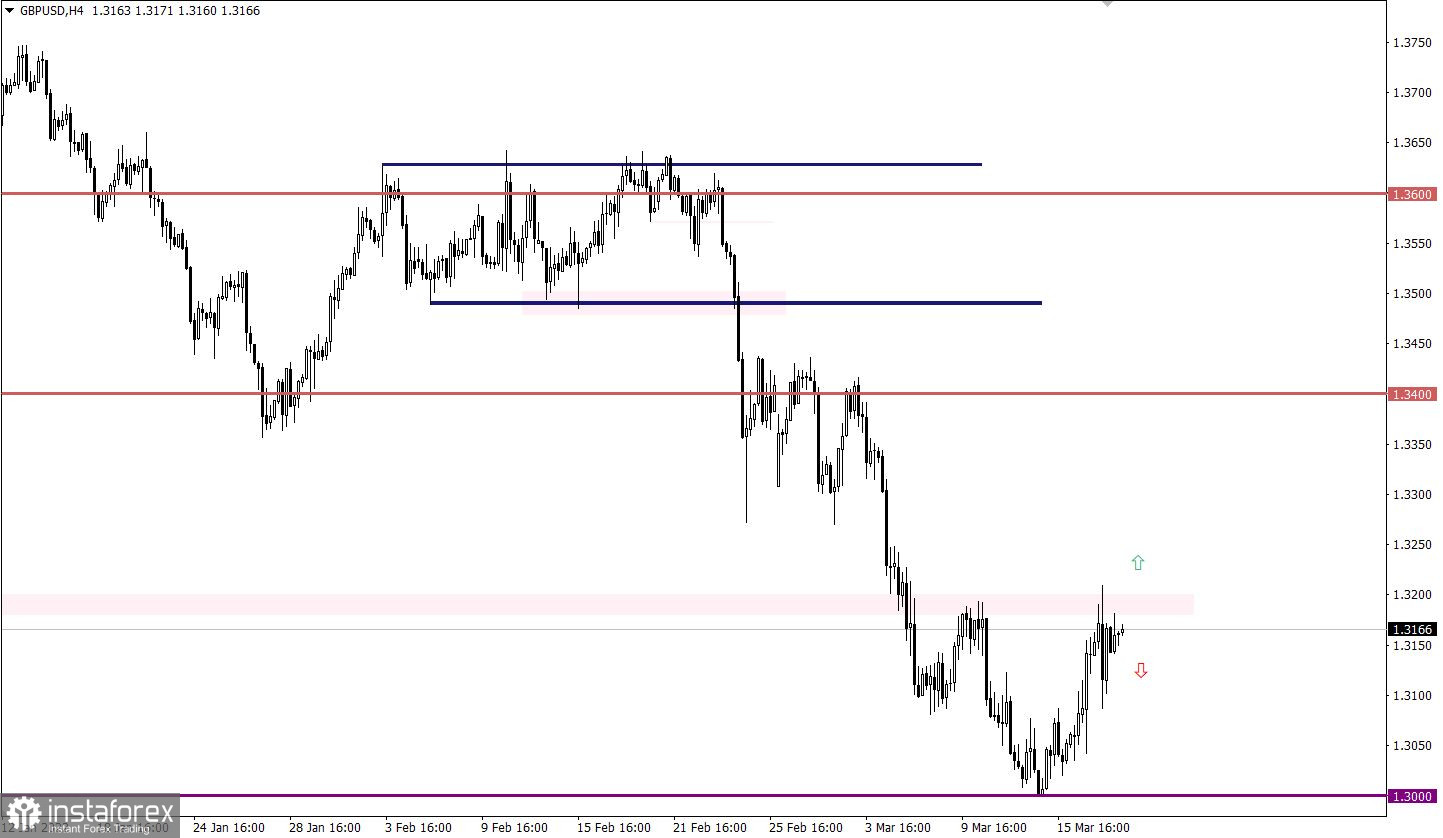
During the corrective movement, the GBPUSD currency pair returned the quote to the local maximum on March 10, where there is resistance at 1.3180/1.3200. The convergence of the price with the area of resistance led to a reduction in the volume of long positions and, as a result, a slowdown in the corrective move.

March 18 economic calendar:
Today the macroeconomic calendar is half empty, the only thing that will be published is data on the sale of existing homes in the United States. In this case, the indicators come out at the close of the European session and are not particularly important on the market.
Time targeting
U.S. existing home sales for February - 14:00 UTC (Forecast -1.0%)
Trading plan for EUR/USD on March 18:
The signal about the prolongation of the corrective move can be confirmed only after the price holds above the resistance area in a four-hour period. Until this moment, the tactics of working on a price rebound is preserved, which in the future may give a recovery move relative to the corrective movement.

Trading plan for GBP/USD on March 18:
In this situation, a slowdown in the corrective move may well signal a change in trading interests. The signal to sell the pound sterling will come from the market when the price is kept below 1.3100. This move may indicate a price rebound from the resistance area.
An alternative scenario for the development of the market will be considered by traders in case of prolongation of the corrective move. A signal for action will be received at the moment the price holds above the value of 1.3200 in a four-hour period.

What is reflected in the trading charts?
A candlestick chart view is graphical rectangles of white and black light, with sticks on top and bottom. When analyzing each candle in detail, you will see its characteristics of a relative period: the opening price, closing price, and maximum and minimum prices.
Horizontal levels are price coordinates, relative to which a stop or a price reversal may occur. These levels are called support and resistance in the market.
Circles and rectangles are highlighted examples where the price of the story unfolded. This color selection indicates horizontal lines that may put pressure on the quote in the future.
The up/down arrows are the reference points of the possible price direction in the future.


