


What is needed to open long positions on GBP/USD
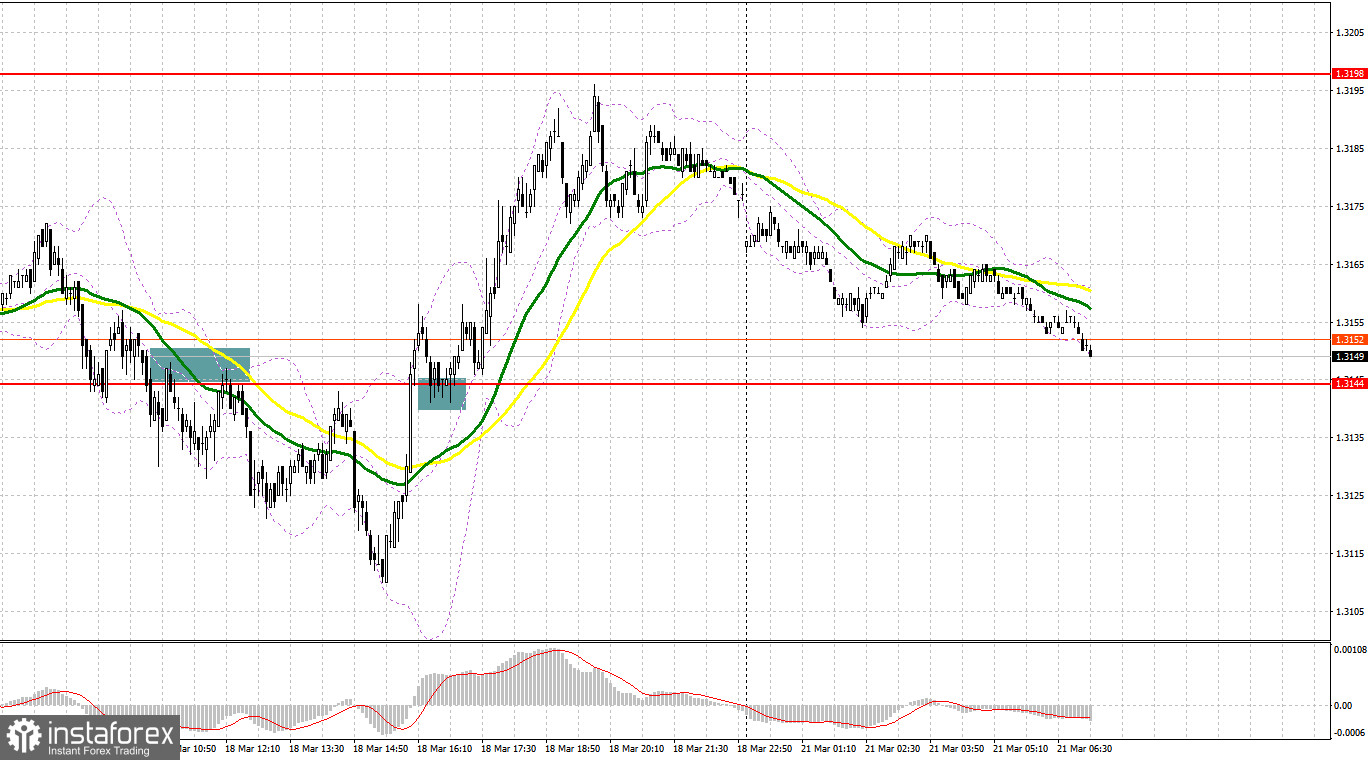
Last Friday, GBP/USD formed a few excellent market entry signals that enabled us to earn decent money. Now let's take a look at the 5-minute chart and reckon what actually happened. In the morning article, I turned your attention to the level of 1.3144 and recommended making trading decisions with this level is focus. GBP declined to 1.3144 and made a false breakout there that created an excellent point for opening long positions amid the upward move of GBP/USD at the end of the week. However, the speculative zeal was not supported by large market players. So, having climbed 10 pips, the bears broke 1.3144 that activated stop losses. In the second half of the day, the opposite test of 1.3144 upwards generated a signal for opening short positions. As a result, the currency pair dropped more than 35 pips. Eventually, the buyers regained control over GBP/USD in the second half of the day and tested 1.3144 downwards. As a result, the pair generated a buy signal. Later on, the price moved more than 40 pips upwards.
The Bank of England has raised interest rates three times. Nevertheless, at the latest policy meeting the regulator gave a message that it is poised to take a cautious approach. Thus, demand for GBP decreased. However, traders are still interested in buying GBP despite its decline. This interest is confirmed by trading activity on Friday. Persistent inflation remains the culprit for the Bank of England's hawkish rhetoric. More rate hikes will follow on condition that the geopolitical conflict between Russia and Ukraine develops towards some peaceful agreement.
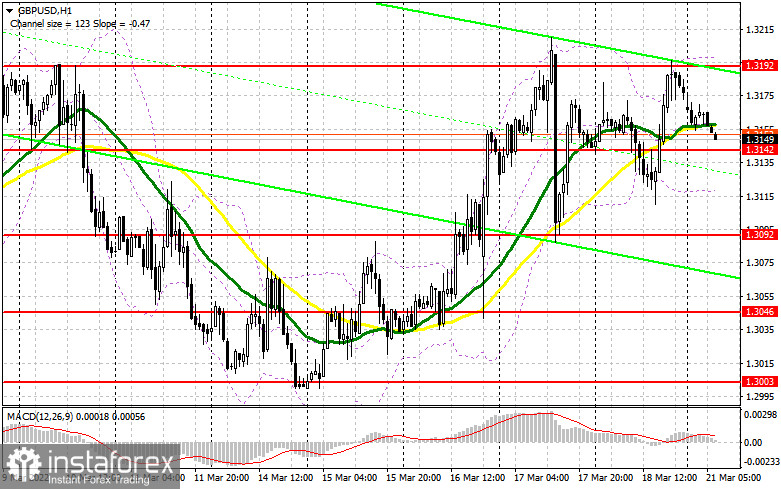
The buyers' major task in the European session is to protect support at 1.3142. This new level is of great interest for both sellers and buyers. We could plan long positions from it after a false breakout because there is no fundamental statistics from the UK today. GBP/USD is expected to grow to the upper border of the sideways channel that is 1.3192. It failed to overcome this level and to escape from the range on Friday. A breakout and the opposite test of this level downwards will activate sellers' stop orders, thus enabling bulls to push the price to new highs at 1.3244 and 1.3275. 1.3314 is seen as a more distant target where I recommend profit taking. However, it will be open in case of good news on the Russia – Ukraine talks.
If GBP/USD trades lower in the European session and bulls lack activity at 1.3142 (where moving averages are passing to their benefit), it would be better to cancel buying against the trend until new support at 1.3092. This is a more reliable level that also serves as the lower border of the trading range. It would be better to open long positions there only on condition of a false breakout. We could buy GBP/USD immediately at a drop off 1.3046 or lower at a low of 1.3003, bearing in mind a 30-35-pips intraday correction.
What is needed to open short positions on GBP/USD
The bears tried to take control over the market, but they failed to close the week below the middle line of the range at 1.3142. The sellers' priority today is support at 1.3142. A breakout and the opposite test of this level upwards like I described above will generate a sell signal that will open the door towards lows at 1.3092 and 1.3046 where I recommend profit taking. 1.3003 would be a more distant target. However, such a sharp fall will come into play on the back of the escalating geopolitical conflict. In case GBP/USD grows in the first half of the day (that I don't rely on because of the empty economic calendar), a false breakout at 1.3193 will provide a sell signal with a view to a new decline in GBP/USD. If the sellers are weak at this level, it would be better to cancel selling until the next large resistance at 1.3244. It would be a good decision to open short positions there at a false breakout. We could sell GBP/USD immediately at a bounce off 1.3275 or higher from a high at 1.3314, bearing in mind a 20-25-pips intraday correction.
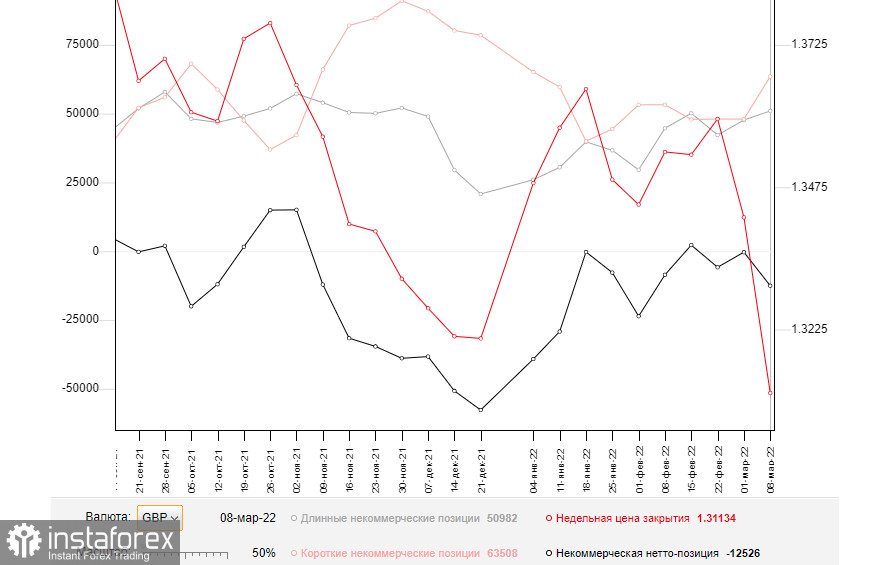
The COT report from March 8 logs a sharp increase both in long and short positions. Somebody rushed to speculate amid the panic in the market, others bought the pair at lower prices. However, those who added long positions are more numerous. It increased the negative delta. Last week, market participants were focused on the crucial event, the policy meeting of the Federal Reserve. They were eager to find out how the Fed would respond to soaring inflation that accelerated to the highest mark in the last 40 years. Aggressive monetary tightening will boost demand for USD. The firm greenback had been already pushing GBP to new one-year lows every day. Another thing is that Russia and Ukraine have not made any notable progress towards some peaceful solutions yet despite a few rounds of the talks. In this context, I would recommend we continue buying USD because GBP/USD is still following the overall bearish trend. The only factor to save GBP now is high inflation in the UK that will force the Bank of England to take actions. So, GBP might eventually assert strength. Hence, selling GBP/USD at lows, think about your tomorrow.
According to the latest COT report, long non-commercial positions grew from 47,679 to 50,982 whereas short non-commercial positions jumped from 48,016 to 63,508. This increased the negative delta of the non-commercial net positions from -337 to -12,526. GBP/USD closed last week at 1.3113 against 1.3422.
Indicators' signals:
Trading is carried out slightly above the 30 and 50 daily moving averages. It indicates that the bulls are making efforts to push the price up.
Moving averages
Note: The period and prices of moving averages are considered by the author on the H1 hourly chart and differs from the general definition of the classic daily moving averages on the daily D1 chart.
Bollinger Bands
If GBP/USD declines, the indicator's lower border at 1.3120 will serve as support. Otherwise, if the currency pair grows, the upper border at nearly 1.3195 will serve as resistance.
Description of indicators
- Moving average (moving average, determines the current trend by smoothing out volatility and noise). Period 50. It is marked yellow on the chart.
- Moving average (moving average, determines the current trend by smoothing out volatility and noise). Period 30. It is marked green on the chart.
- MACD indicator (Moving Average Convergence/Divergence — convergence/divergence of moving averages) Quick EMA period 12. Slow EMA period to 26. SMA period 9
- Bollinger Bands (Bollinger Bands). Period 20
- Non-commercial speculative traders, such as individual traders, hedge funds, and large institutions that use the futures market for speculative purposes and meet certain requirements.
- Long non-commercial positions represent the total long open position of non-commercial traders.
- Short non-commercial positions represent the total short open position of non-commercial traders.
- Total non-commercial net position is the difference between short and long positions of non-commercial traders.


