Long positions on GBP/USD:
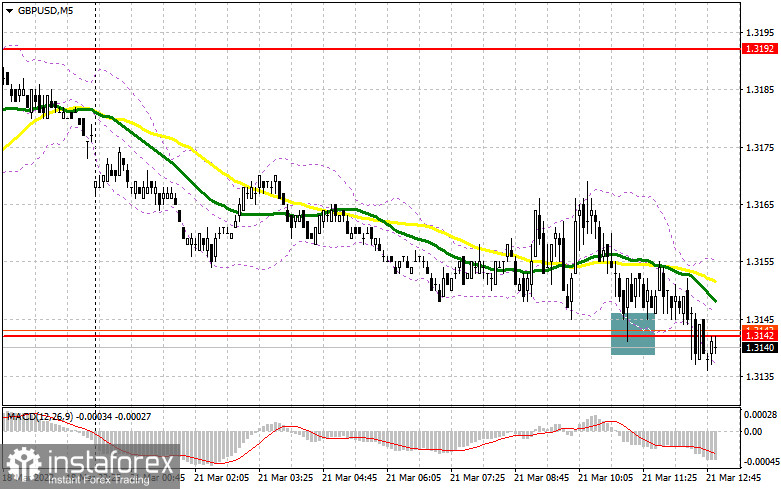
In my forecast this morning, I drew your attention to the level of 1.3142 and recommended entering the market from it. Let's have a look at the 5-minute chart and analyze what happened. The decline of the pound to the area of 1.3142 and the formation of a false breakout there created an excellent entry point into long positions counting on the rise of the pair. However, the evident speculative enthusiasm was not supported by large market players, so after the 10-pip upward move, the pressure on the pair returned. It looks like bears are trying to break through support at 1.3142 and the lower boundary of the sideways channel. Technically, nothing has changed in the second half of the day.

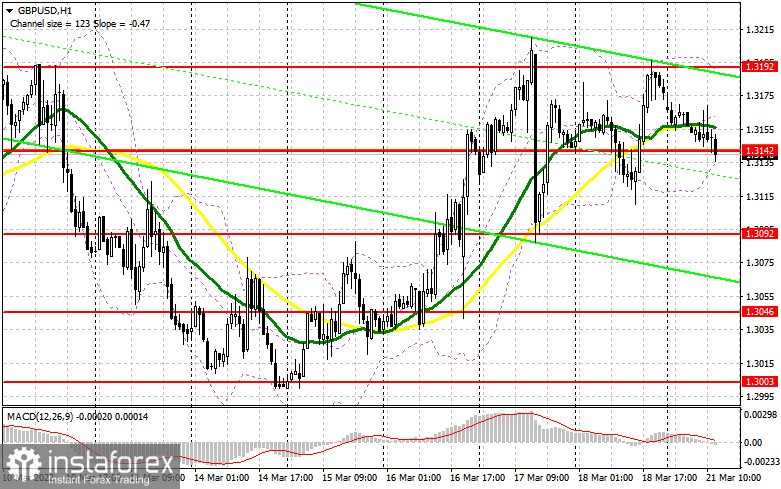
Lack of positive geopolitical news and strong fundamental data did not allow bulls to productively act in the morning. They tried to hold the price above 1.3142 which indicates the willingness of the pound sellers to return the pair to the area of 1.3092, where active purchases of large players were observed last week. There is also no statistical data for the second half of the day, so I expect a low volatility in the pair. If the pair declines during the US session, the level of 1.3092 may become an entry point. Long positions from this level may be considered only after the false breakout. Bulls need to push the price above resistance at 1.3142. Reaching above this level with a retest of this area top/bottom, may allow the buyers to get close to the last week's high of 1.3192. It is unlikely that somebody would like to buy above this level, so it is better to lock in profits there. The next target is the area of 1.3244. In the scenario of GBP/USD decline during the US session and absence of bulls at 1.3092, it is better to postpone buying against the trend until the price touches support at 1.3046, as it is a more strong level. However, it is better to open long positions there only if a false breakout occurs. Traders may consider buying the GBP/USD pair on the rebound from 1.3003 or lower from 1.2966, allowing an intraday correction of 30-35 pips.
Short positions on GBP/USD:
Bears managed to push the pair to 1.3142, counting on a breakthrough of this level in the near future. Today, the target for the sellers is the area of 1.3142. In case of breakthrough and a reverse test of this level bottom/top, it is better to open short positions with the aim to decline to support of 1.3092. A breakthrough and a reverse test of this level from below may create an additional sell signal, opening a path to the lows of 1.3046 and 1.3003, where traders may take profit. However, this scenario is unlikely to happen, since high volatility is not expected in the second half of the day. In the case of GBP/USD pair growth during the US session and a lack of activity at 1.3142, it is better to postpone selling the pound until the pair reaches resistance at 1.3192. Opening short positions there is possible in case of a false breakout there. It is possible to sell the pound on a rebound from 1.3244 or from the high of 1.3275, allowing a downward intraday correction of 20-25 pips.


Indicators' signals:
Trading is carried out near the 30 and 50 daily moving averages. It indicates uncertainty in the market.
Moving averages
Note: The period and prices of moving averages are considered by the author on the H1 hourly chart and differs from the general definition of the classic daily moving averages on the daily D1 chart.
Bollinger Bands
A breakthrough of the indicator's lower boundary at 1.3129 will increase pressure on the pound. A breakthrough of the upper boundary of the indicator at 1.3192 will lead to the growth of the pair.
Description of indicators
- Moving average (moving average, determines the current trend by smoothing out volatility and noise). Period 50. It is marked yellow on the chart.
- Moving average (moving average, determines the current trend by smoothing out volatility and noise). Period 30. It is marked green on the chart.
- MACD indicator (Moving Average Convergence/Divergence — convergence/divergence of moving averages) Quick EMA period 12. Slow EMA period to 26. SMA period 9
- Bollinger Bands (Bollinger Bands). Period 20
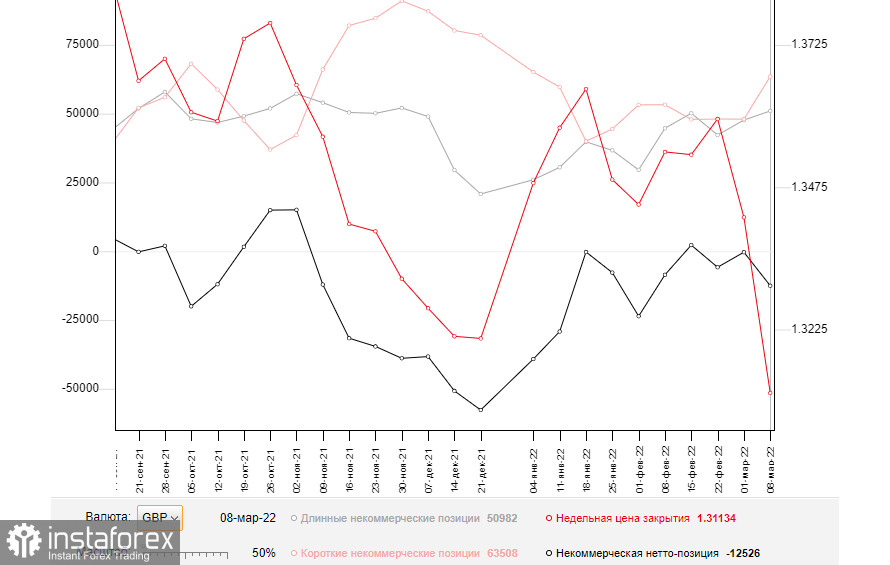
- Non-commercial speculative traders, such as individual traders, hedge funds, and large institutions that use the futures market for speculative purposes and meet certain requirements.
- Long non-commercial positions represent the total long open position of non-commercial traders.
- Short non-commercial positions represent the total short open position of non-commercial traders.
- Total non-commercial net position is the difference between short and long positions of non-commercial traders.


