EUR/USD
Analysis:
The EUR/USD chart has been dominated by a downtrend since the beginning of last year. A preliminary calculation shows about 3 price points to the upper limit of the target area from the current values. The incomplete stretch started on March 9. The corrective phase of the move ended three days ago.
Outlook:
Today, the most likely movement of the euro chart will be a flat bounce from the support to the resistance zone. Then we can expect a change of course and a second, more active decline.
Potential reversal zones
Resistance:
- 1.1050/1.1080
Support:
- 1.0970/1.0940
Recommendations:
Trading in a flat is much riskier and can lead to deposit losses. It is recommended to refrain from entering the euro market until there are confirmed sell signals around the resistance zone.

USD/JPY
Analysis:
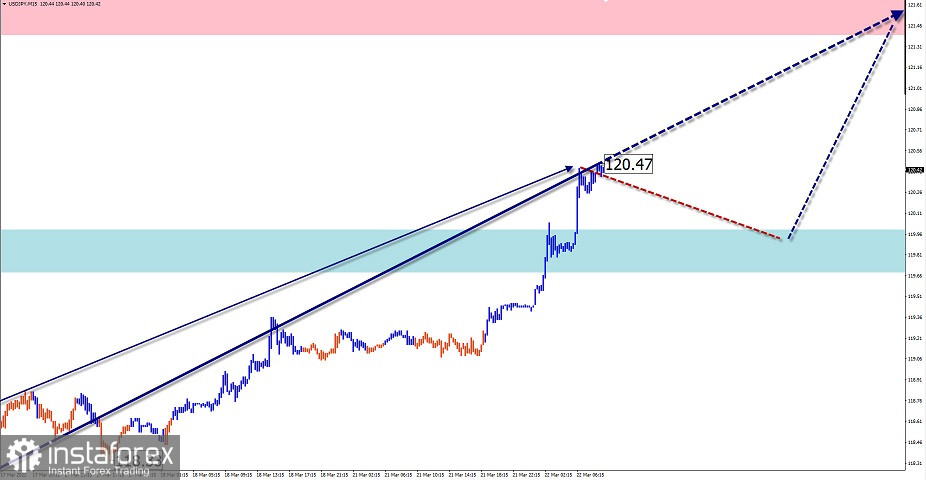
The current price movements of the major Japanese yen pair are accommodated in the ascending wave zigzag algorithm from March 9, 2020. Quotes have now reached the borders of the strong potential reversal zone of the weekly scale. The wave structure looks complete, but there are no signals of an imminent reversal on the chart.
Outlook:
In the near future, the general upward movement is expected to continue, up to the estimated resistance. In the first half of the day short-term decline to the support zone is not excluded. In the next days it is possible to count on the formation of the beginning of a counter wave.
Potential reversal zones
Resistance:
- 121.40/121.70
Support:
- 120.00/119.70
Recommendations:
Short-term buying of the Japanese Yen with a reduced lot will be possible in the upcoming trading sessions. In the area of the estimated resistance it is recommended to fix profits.

GBP/JPY
Analysis:
The latest stretch of the dominant uptrend of the GBP/JPY cross has been running since March 4. The movement has a pronounced impulsive nature. At the moment of the analysis the quotes are near the upper border of the strong resistance zone of the large scale. A retracement phase is required for a continuation of the price rise.
Outlook:
In the nearest twenty-four hours there is a high probability of cross movement to the sideways plane. As an option, short-term decline to the support zone is possible. At the end of day or tomorrow it is possible to wait for renewal of an ascending vector of price movement.
Potential reversal zones
Resistance:
- 158.30/158.60
Support:
- 157.30/157.00
Recommendations:
There are no selling conditions on the cross chart today. It is recommended to refrain from entering the pair's market until the upcoming pullback is completed. Optimal area to search for buying signals is the area of estimated support.

GOLD
Analysis:
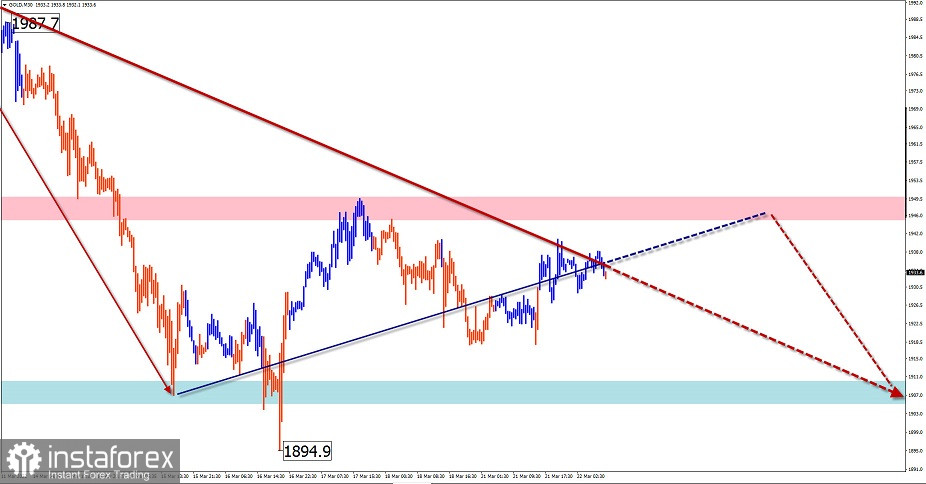
The incomplete wave pattern in the gold market today counts down from March 3. Gold has been correcting sideways since last week. The structure of this wave does not look complete at the time of analysis.
Outlook:
In the coming day, sideways movement in the price corridor between the closest encounter zones is likely to continue. After a possible pressure on the resistance zone at the end of the day, we can expect a change of direction and a decline to the support area.
Potential reversal zones
Resistance:
- 1945.0/1950.0
Support:
- 1910.0/1905.0
Recommendations:
Trading in the gold market today can only be profitable in individual sessions with fractional lots. Opening short positions is more promising.

Explanation: In simplified wave analysis (SVA), waves consist of 3 parts (A-B-C). The last unfinished wave is analysed. The solid arrow background shows the structure formed. The dotted arrow shows the expected movements.
Attention: The wave algorithm does not take into account the duration of the instrument movements over time!


