


Analysis of Tuesday's deals:
30M chart of the EUR/USD pair.
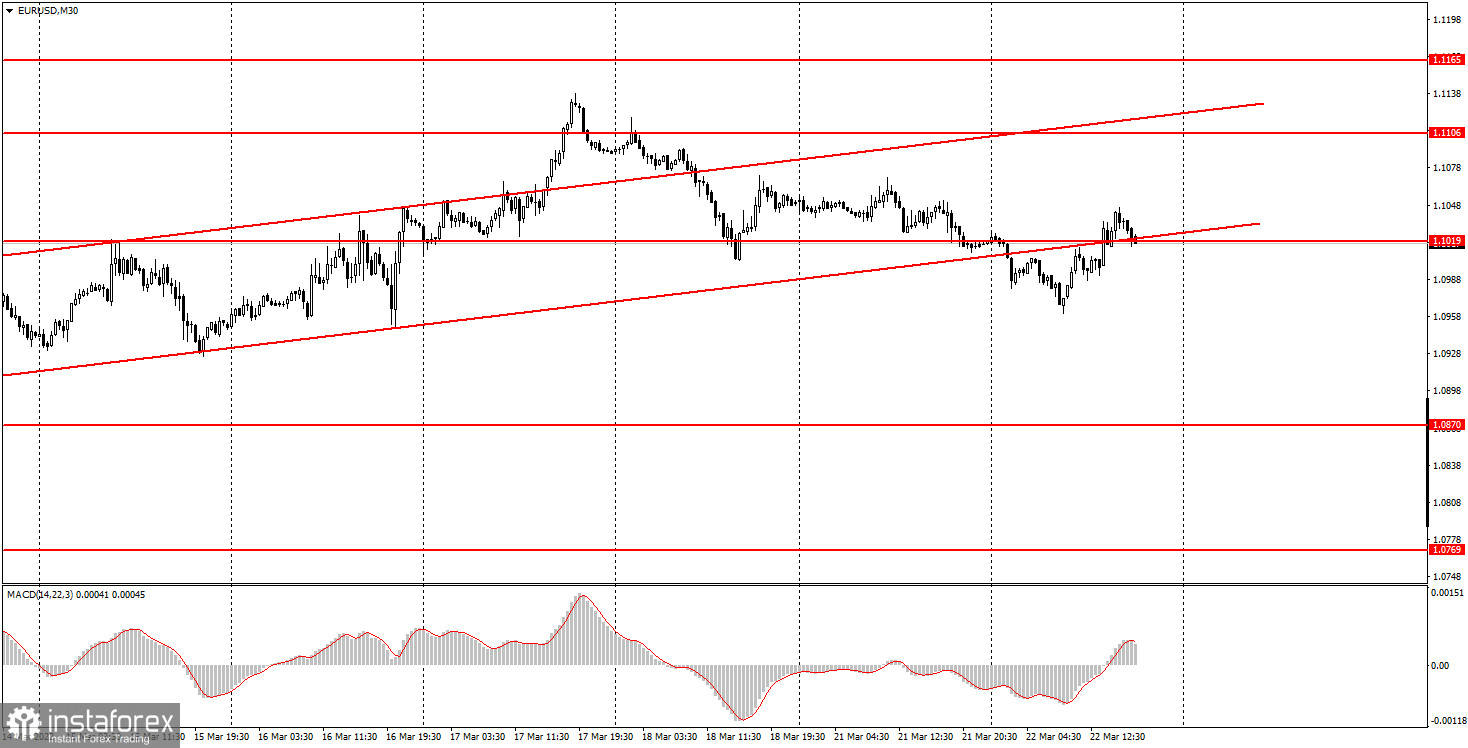
The EUR/USD currency pair was trading again on Tuesday in its best traditions of a month ago. Volatility has increased slightly and has already reached more than 80 points, which is a very good indicator for the euro currency. However, the very nature of the movement left much to be desired. Frequent reversals, frequent pullbacks, lack of a clear intraday trend. And all this although during the day there was not a single important event to which the market could react. Today, there was another speech by the head of the ECB, Christine Lagarde, who simply cannot tell anything new to the market right now. She just repeats in a veiled way from time to time that the European economy is too weak, the ECB is not going to follow the Fed's example in raising rates, and the rate hike itself is currently unavailable to the regulator. Thus, there is no fundamental support for the euro right now. Moreover, the pair managed to gain a foothold below the ascending channel today, so the trend has changed to a downward one. However, at the same time, the price was mostly rising, not falling, so we assume that the nature of the movement in the coming days will remain unfavorable for traders.
5M chart of the EUR/USD pair.
On the 5-minute timeframe, it is even better to see exactly how the pair moved during the day. The most important levels were simply ignored, false signals were formed around them, and the price constantly jumped in different directions. Of course, the tool cannot show perfect movements every day, on which everyone will earn. This is the art of trading to get minimal losses and maximum profit. Let's look at today's deals. The first signal was formed in the middle of the European session when the price overcame the already irrelevant level of 1,1003. Formally, it was a buy signal, but the price could not go up after its formation and 10 points. This was followed by consolidation below the level of 1,1003, and this time the price could not go down even 10 points. Two false signals brought losses to traders. All subsequent signals near the 1.1003 level should have already been ignored. It was possible to work out a buy signal about overcoming the level of 1.1019, however, it turned out to be false. But here the price at least went 15 points up, allowing beginners to set a Stop Loss at breakeven. Therefore, the deal closed at zero here. The 1.1046 level is a new level.
How to trade on Wednesday:
On the 30-minute timeframe, the pair has consolidated below the ascending channel and may continue to move down this week. The fundamental background speaks in favor of this. However, you need to be prepared for the fact that the movements will be as uncomfortable as possible for traders, especially for beginners. On the 5-minute TF tomorrow, it is recommended to trade by levels: 1.0932, 1.0961, 1.1019, 1.1046, 1.1070, 1.1106, 1.1136. When passing 15 points in the right direction, you should set the Stop Loss to breakeven. On Wednesday, no important events are scheduled in the European Union, and a new performance by Jerome Powell will take place in the United States. From our point of view, it is Powell's speech with his updated rhetoric that can provoke a market reaction. However, as before, everything will depend on what exactly Powell says. He, for example, can comment on cryptocurrencies or the geopolitical conflict in Ukraine.
Basic rules of the trading system:
1) The strength of the signal is calculated by the time it took to generate the signal (rebound or overcome the level). The less time it took, the stronger the signal.
2) If two or more trades were opened near a certain level on false signals, then all subsequent signals from this level should be ignored.
3) In a flat, any pair can form a lot of false signals or not form them at all. But in any case, at the first signs of a flat, it is better to stop trading.
4) Trade transactions are opened in the period between the beginning of the European session and the middle of the American session when all transactions must be closed manually.
5) On a 30-minute TF, signals from the MACD indicator can be traded only if there is good volatility and a trend, which is confirmed by a trend line or a trend channel.
6) If two levels are located too close to each other (from 5 to 15 points), then they should be considered as a support or resistance area.
What's on the charts:
Price support and resistance levels - target levels when opening purchases or sales. Take Profit levels can be placed near them.
Red lines - channels or trend lines that display the current trend and show in which direction it is preferable to trade now.
MACD indicator (14, 22, 3) - a histogram and a signal line; an auxiliary indicator that can also be used as a signal source.
Important speeches and reports (always contained in the news calendar) can greatly influence the movement of a currency pair. Therefore, during their exit, it is recommended to trade as carefully as possible or exit the market to avoid a sharp price reversal against the previous movement.
Beginners to trade in the forex market should remember that every transaction cannot be profitable. Developing a clear strategy and money management is the key to success in trading for a long period.


