


Trend analysis (Fig. 1).
The market may move up from the level of 1.1029 (close of yesterday's daily candle) to the target of 1.1064, the 38.2% retracement level (blue dotted line). After testing this level, the price may continue to move upward to the target level of 1.1082, the resistance line (thick red line). A downward rollback is possible from this line.
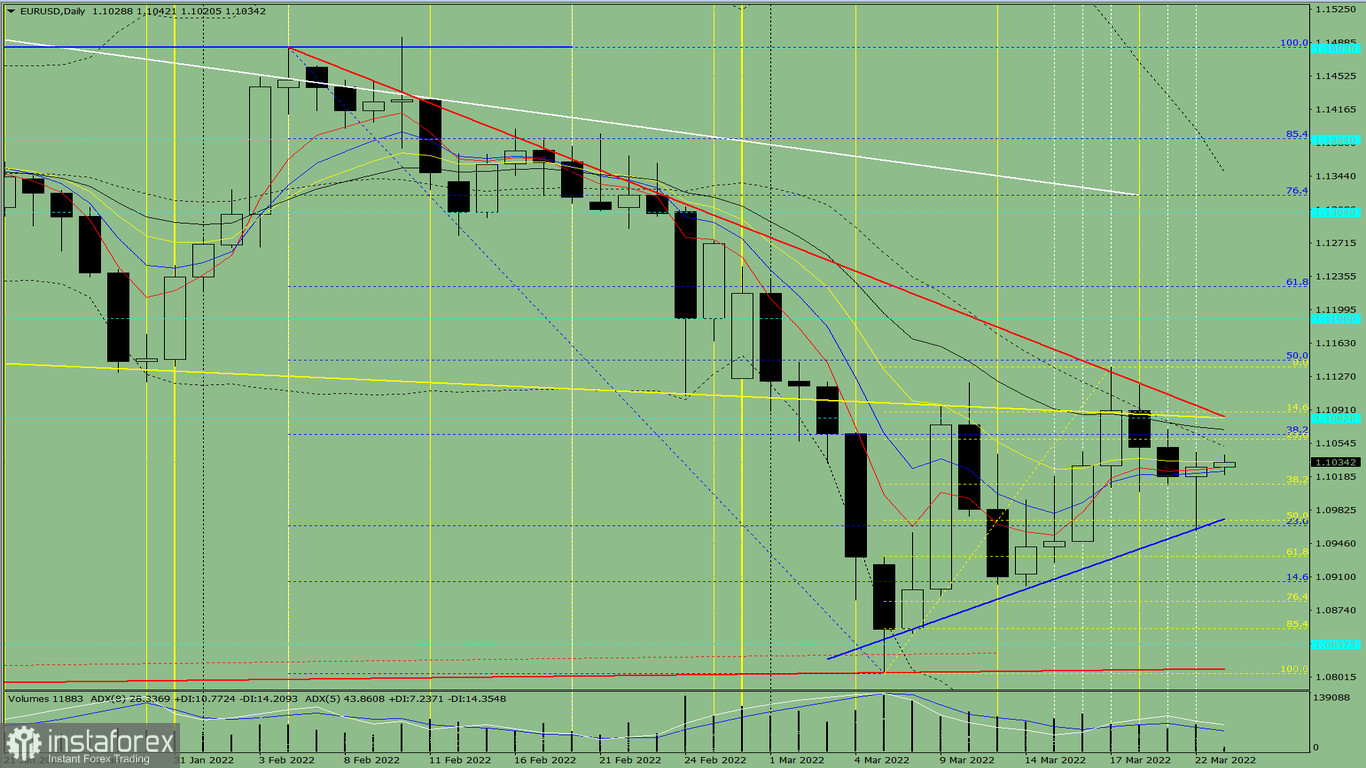
Fig. 1 (daily chart).
Comprehensive analysis:
- Indicator analysis - up;
- Fibonacci levels - up;
- Volumes - up;
- Candlestick analysis - up;
- Trend analysis - up;
- Bollinger bands - up;
- Weekly chart - up.
General conclusion:
The price may move up from the level of 1.1029 (close of yesterday's daily candle) to the target of 1.1064, the 38.2% retracement level (blue dotted line). After testing this level, the price may continue to move upward to the target level of 1.1082, the resistance line (thick red line). A downward rollback is possible from this line.
Alternative scenario: from the level of 1.1029 (close of yesterday's daily candle), the price may move up to the target level of 1.1064, the 38.2% retracement level (blue dotted line). After testing this level, the price may continue to move upward to the target level of 1.1082, the resistance line (thick red line). In case of testing this level, continued upward movement is possible to 1.1145, the 50.0% retracement level (blue dotted line).


