


Hello!
Today, we will sum up the trading results of the previous week and try to determine where the AUD/USD pair could go further.
Weekly
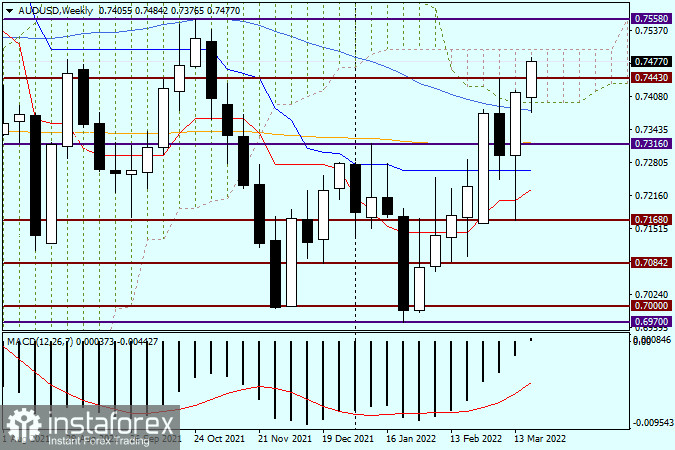
Last week, the Aussie dollar showed relatively steady growth versus its American counterpart. It wasn't, however, the easiest trading week for AUD bulls. After falling to 0.7168, the pair encountered support and reversed. The reversal came partially due to the influence of the blue Kijun Line and the red Tenkan Line of the Ichimoku indicator. The pair was moving below those lines when the reversal took place. On Friday, the price closed above the blue 50-day moving average and within the limits of the Ichimoku Cloud. This week, AUD/USD is expected to extend the uptrend.
At the moment of writing, the pair trades above resistance at 0.7443. The target is seen at the upper limit of the Cloud. If the price breaks through the upper limit, it may then head towards resistance at 0.7558. A technical correction to the 50-day MA occurred where the quote encountered support and reversed up. If bullish activity decreases, a bearish reversal pattern will form and the price will close below the lower limit of the Cloud and the 50-day MA. If so, the bull run will be over. However, given the previous weekly candlestick with a long lower shadow, we may expect bullish AUD/USD.
Daily
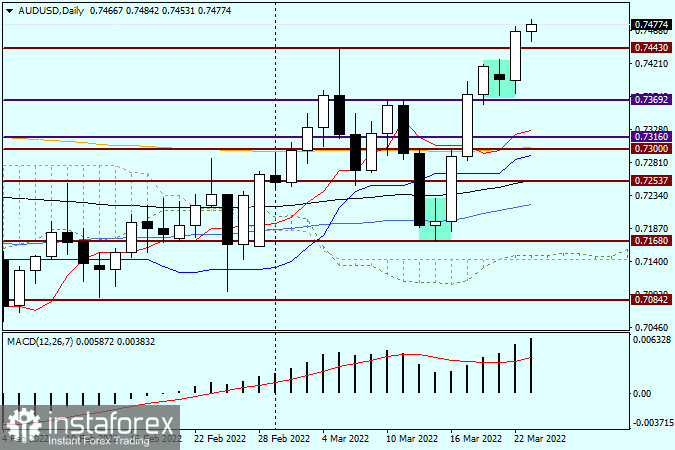
On the daily chart, the Doji candlestick as of March 15 has transformed into a reversal pattern. The pair soared right after its formation. However, when the Harami candlestick appeared on the chart on March 21, the possibility of a further bullish move became vague. Yet, it was engulfed by the uptrend the following day, which only confirmed bullish bias. At the moment of writing, the pair has encountered strong resistance at 0.7480 but hasn't stopped its attempts to extend growth.
Taking into account the technical pictures of the two charts, it is now wiser to go long. However, the Aussie dollar's growth has somewhat slowed near the important psychological and historical level of 0.7500. So, you could go long when the quote pulls back to resistance at 0.7443 and bullish candlestick patterns are formed. Likewise, long positions could be opened on a pullback to 0.7500 after a true breakout there.
Have a nice trading week!


