What is needed to open long positions on GBP/USD:
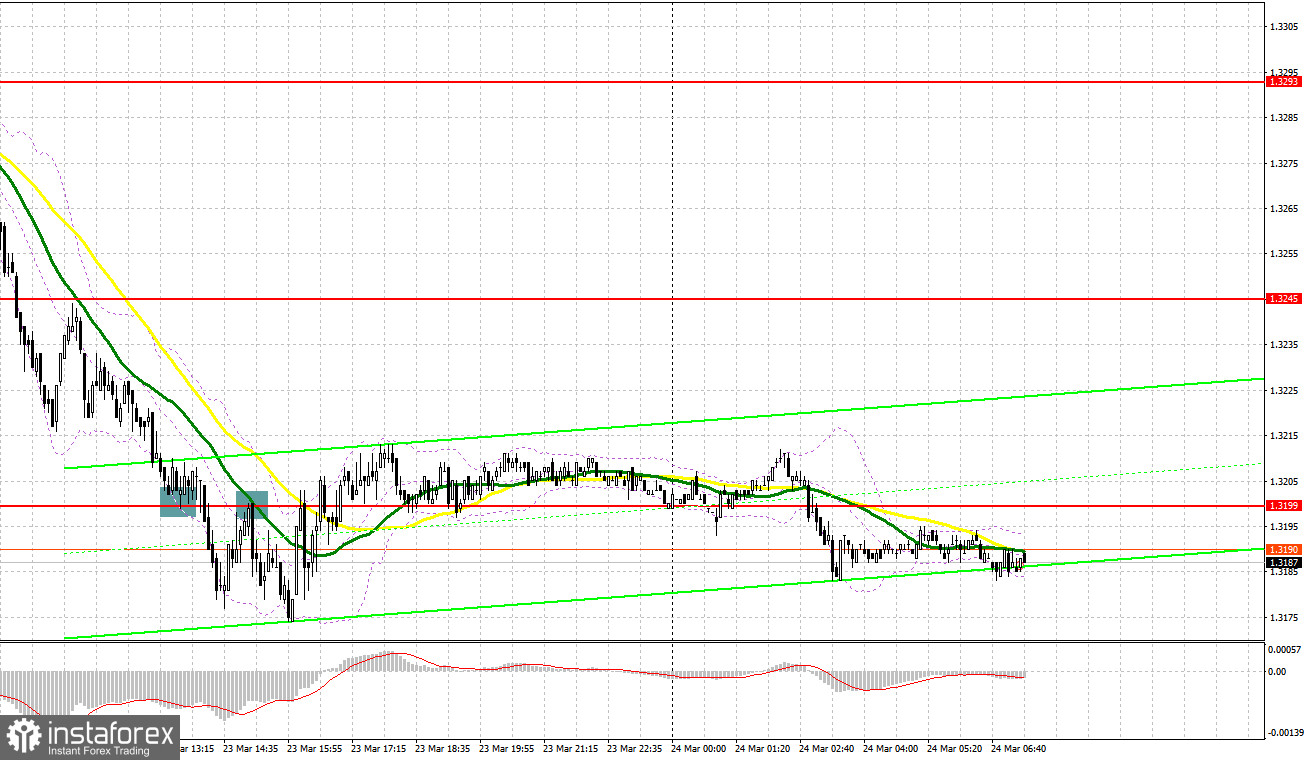
Yesterday, it was quite difficult to trade the pound sterling ahead of the US inflation and annual budget reports. Now, let's look at the 5-minute chart and try to figure out what actually happened. In the morning article, I highlighted the level of 1.3249 and recommended taking decisions with this level in focus. The breakout of 1.3249 occurred quite quickly. The British currency slid down due to discoursing inflation data. The figure exceeded economists' forecasts. Although there was a breakout of this level, it lacked only several pips for an upward test. For this reason, there was no good entry point into short positions. In the afternoon, the pound sterling dropped to the level of 1.3199, making a false breakout. As a result, a buy signal was formed. Traders had to close short positions as an upward reversal did not take place. A breakout of 1.3199 and a reverse test from the bottom up gave a sell signal, intensifying the downtrend. After that, the pair fell by 25 pips. This was yesterday's gains.

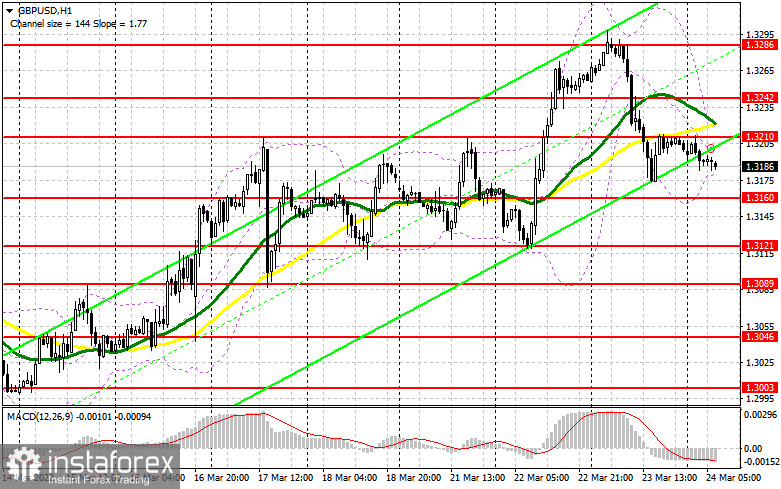
Surging inflation is now weighing on not only the government but also on household incomes. The standard of living is rapidly falling, which has a negative impact on the foreign exchange market. Chancellor Rishi Sunak said he would consider raising benefits and pensions to keep pace with inflation and help lower earners. Notably, the pound sterling still maintains a bullish trend stat has originated on March 14. Nevertheless, traders should act carefully. To cement the upward movement, the bulls need to defend the support level of 1.3160 during the European session today will be to protect the support of 1.3160. The pound sterling is also likely to break through this level in the near future. After that, it will become clear whether traders remained in the market after Tuesday's growth. If not, the British currency could decline even lower. Only after the formation of a false breakout at 1.3160, the pound/dollar pair may recover. If this scenario comes true, the bulls will quickly push GBP/USD to the resistance level of 1.3210. Slightly above this level, one can see the moving averages that are passing in the negative zone. Given that the economic calendar is empty today, there could be a large upward correction. A breakout and a test of this level from top to bottom will lead to a decrease in the volume of sellers' stop orders. As a result, the price is likely to rise to the highs of1.3242 and 1.3286. The 1.3340 level will be a more distant target. The pair may approach it provided that there will be positive news on the talks between Russia and Ukraine. I recommend profit-taking at this level. If the GBP/USD pair tumbles during the European session and bulls show no activity at 1.3160, it is best to postpone long positions until the next support level of 1.3121. This is a more reliable level, acting as the lower limit of the new upward channel. I would also advise you to open long positions there only when a false breakout occurs. You can buy GBP/USD immediately on a rebound from 1.3089 or even a lower low of 1.3046, keeping in mind an intraday correction of 30-35 pips.
What is needed to open short positions on GBP/USD:
The bears pushed the pound sterling to the level of 1.3210, which limited the upward potential. It may also undermine the bull market that began on March 14. Given that there are no fundamental statistics today, the bulls will try to regain ground in the morning. For this reason, the primary task of the bears is to protect the resistance level of 1.3210, where the moving averages are passing in the negative zone. The formation of a false breakout there will push the pair to the nearest support level of 1.3160. A breakout and an upward test of this level will give an additional sell signal. As a result, the pair may drop to the lows of 1.3121 and 1.3089 where I recommend profit-taking. A more distant target will be 1.3046. If GBP/USD rises in the first half of the day and bears show no activity at 1.3210, it is best to postpone short positions until the next major resistance level at 1.3242. I would also advise you to open short positions there in case of a false breakout. It is possible to sell GBP/USD immediately for a rebound from 1.3286 or even a higher high of 1.3340, keeping in mind an intraday downward correction of 20-25 pips.

COT report
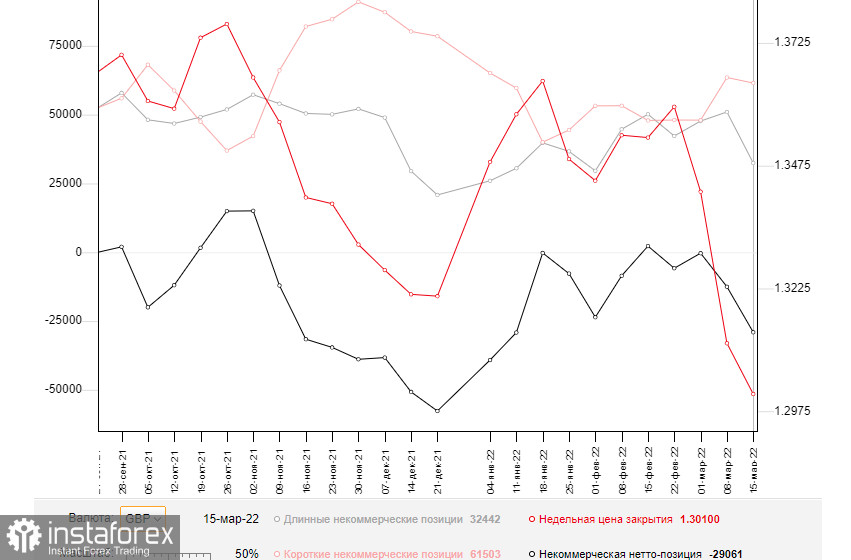
The COT report (Commitment of Traders) for March 15 logged a sharp drop in long positions and only small changes in short ones. The results of the BoE meeting avidly affected the British currency. Despite an expected increase in the interest rate, the regulator did not hint at a further tightening of monetary policy. It decided to stick to more dovish rhetoric despite soaring inflation. It had already reached all-time highs. Falling household income and the worsening standard of living are weighing on the regulator. The regulator is hesitant to take more aggressive measures because of the current geopolitical situation. A more aggressive tightening may harm the economy rather than help it. The regulator needs to find measures to cap rising inflation, avoiding potentially dangerous decisions. Many analysts believe that inflation may climb higher in spring. Therefore, traders are in no hurry to buy the pound sterling. Besides, it is losing momentum against the US dollar. The FOMC meeting was in the limelight last week. The watchdog raised the interest rate by 0.25%. This decision did not stir up volatility as many traders had already priced it in. To this end, it is recommended to open long positions on the US dollar as the bearish trend for the GBP/USD pair persists. The only thing that may halt a sell-off of the pound sterling is high inflation. It will eventually force the Bank of England to take a hawkish stance. The COT report for March 15 revealed that the number of long non-profit positions declined to 32,442 from 50,982, while the number of short non-profit positions dropped to 61,503 from 63,508. It increased in the negative delta of the non-commercial net position to -29,061 from -12,526. The weekly closing price dropped to 1.3010 against 1.3113.

Signals of technical indicators
Moving averages
GBP/USD is trading below 30- and 50-period moving averages. It means that the bears don't give up attempts to undermine the bullish trend.
Remark. The author is analyzing a period and prices of moving averages on the 1-hour chart. So, it differs from the common definition of classic daily moving averages on the daily chart.
Bollinger Bands
In case of a decline in the pair, 1.3185 will act as support. If the pair grows, 1.3230 will act as resistance.
Definitions of technical indicators
- Moving average recognizes an ongoing trend through leveling out volatility and market noise. A 50-period moving average is plotted yellow on the chart.
- Moving average identifies an ongoing trend through leveling out volatility and market noise. A 30-period moving average is displayed as the green line.
- MACD indicator represents a relationship between two moving averages that is a ratio of Moving Average Convergence/Divergence. The MACD is calculated by subtracting the 26-period Exponential Moving Average (EMA) from the 12-period EMA. A 9-day EMA of the MACD called the "signal line".
- Bollinger Bands is a momentum indicator. The upper and lower bands are typically 2 standard deviations +/- from a 20-day simple moving average.
- Non-commercial traders - speculators such as retail traders, hedge funds, and large institutions who use the futures market for speculative purposes and meet certain requirements.
- Non-commercial long positions represent the total long open position of non-commercial traders.
- Non-commercial short positions represent the total short open position of non-commercial traders.
- The overall non-commercial net position balance is the difference between short and long positions of non-commercial traders.


