


Details of the economic calendar of March 23
The growth rate of consumer prices in Britain accelerated from 5.5% to 6.2%. Taking into account that last week the Bank of England announced the forecast of inflation growth to 7.0%, the current figures were not something surprising in the market.
During the American trading session, data on new home sales in the United States will be published, where they predict an increase in the indicator. Given the time of publication and the level of importance, one should not expect any strong reaction in the market.
Analysis of trading charts from March 23
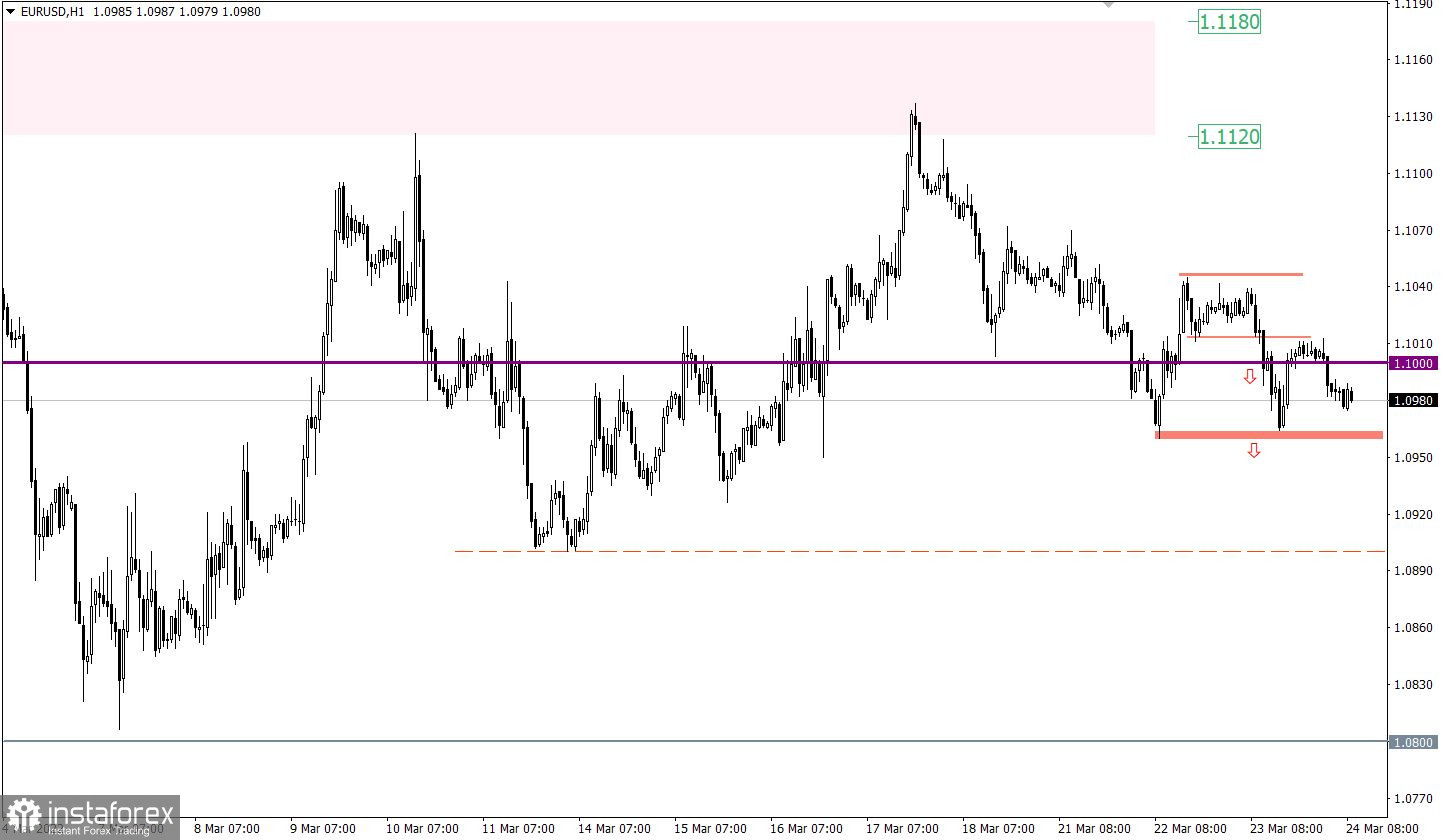
The EURUSD currency pair completed the consolidation move in the range of 1.1010/1.1045 by breaking the lower border. This move led to speculative activity, which allowed traders to hold below the psychological level of 1.1000.
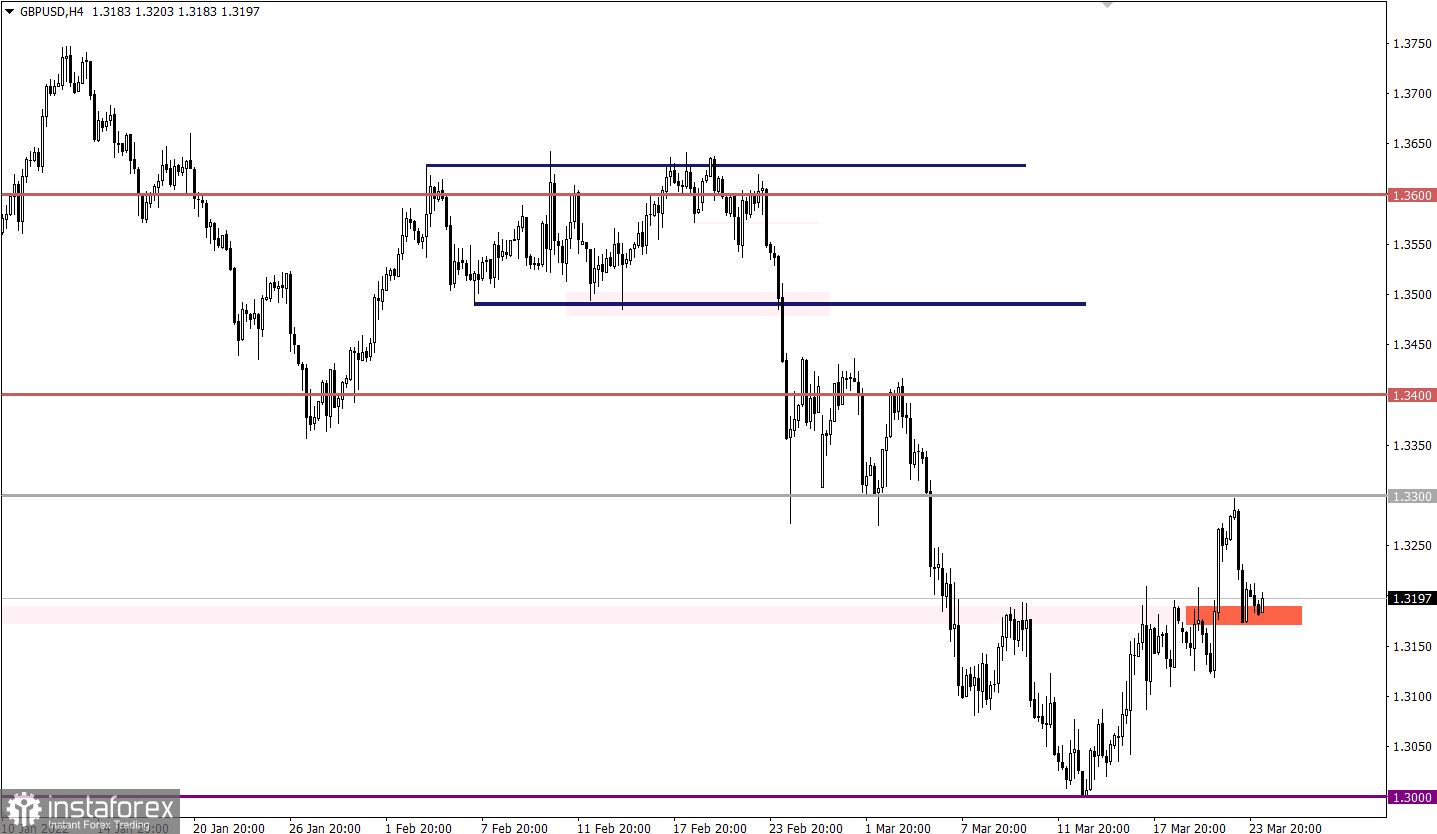
The GBPUSD currency pair, during an intensive upward movement, reached the resistance level of 1.3300, where there was a reduction in the volume of long positions. This led to a rebound in prices and a partial recovery in the U.S. dollar.

March 24 economic calendar
Preliminary data on business activity indices for March in Europe, Britain, and the United States will be published today. They expect a widespread decline in indicators, which may lead to the absence of any reaction in the market if forecasts coincide.
For the United States, data on applications for unemployment benefits will also be published today, where they predict a reduction in their volume. This is a positive factor for the U.S. labor market, which may affect the dollar exchange rate.
Statistics details:
The volume of initial claims for benefits may be reduced from 214,000 to 212,000.
The volume of continuing claims may be reduced from 1.419 million to 1.410 million.
Time targeting
Indices for business activity in the EU - 09:00 Universal time
Indices for business activity in Britain - 09:30 Universal time
U.S. Jobless Claims - 12:30 Universal time
Indices for business activity in the U.S. - 13:45 Universal time
Information and news flow
The summit of EU leaders, as well as the visit of US President Joe Biden to Europe, may push traders to speculative operations. It is worth closely following the flow of news regarding new sanctions against the Russian Federation and the possible imposition of an embargo on oil and gas supplies from Russia.
Trading plan for EUR/USD on March 24
In this situation, the initial signal to sell the euro was received in the course of holding the price below the level of 1.1000. The strengthening of the existing signal will occur when the price is kept below 1.0960 in a four-hour period. This step may well restart dollar positions in the direction of 1.0900-1.0800. Otherwise, we are waiting for a bump in the boundaries of 1.0960 / 1.1150.
Trading plan for GBP/USD on March 24
During the rebound, the quote returned to the area of 1.3175, where there was a slight stagnation. Holding the price below it in a four-hour period will lead to a subsequent increase in the volume of short positions, which will strengthen the downward move.
An alternative scenario for the development of the quote considers the current pullback as part of a corrective move from the 1.3000 level. In this case, the absence of price retention below 1.3175 may lead to a new correction cycle.
What is reflected in the trading charts?
A candlestick chart view is graphical rectangles of white and black light, with sticks on top and bottom. When analyzing each candle in detail, you will see its characteristics of a relative period: the opening price, closing price, and maximum and minimum prices.
Horizontal levels are price coordinates, relative to which a stop or a price reversal may occur. These levels are called support and resistance in the market.
Circles and rectangles are highlighted examples where the price of the story unfolded. This color selection indicates horizontal lines that may put pressure on the quote in the future.
The up/down arrows are the reference points of the possible price direction in the future.


