


Hello!
The technical picture will be the key focus in today's article on the USD/CAD pair. However, before discussing the technical analysis of this trading instrument, let's mention the factors which support this pair. The US Federal Reserve's hawkish stance is favorable for the US dollar. The Fed has already started to raise the federal funds rate and is determined to pursue it. The main reasons for this position are high inflation and a strong US economy which has evidently recovered from the negative consequences of the COVID-19 pandemic. High oil prices, updating the previous highs, traditionally prop up the Canadian dollar. Now let's discover which currency is in high demand for market players in the current situation. Despite the fact that the weekly trading ended, I want to start a technical analysis with the weekly chart. It is necessary to assess the situation more thoroughly and accurately.
Weekly
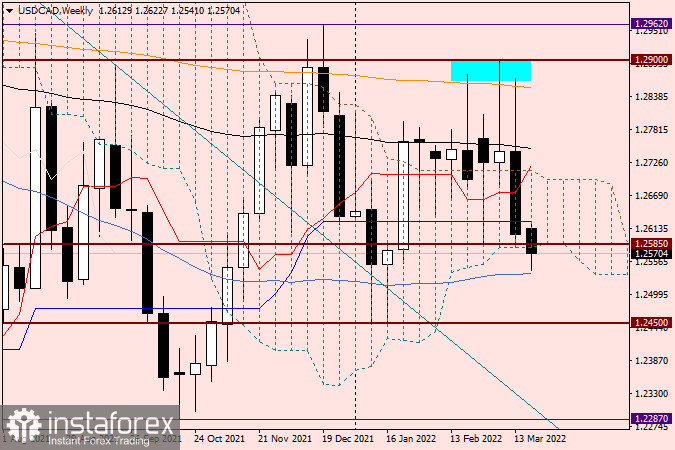
As for the weekly timeframe, long upper shadows of several previous candlesticks and the failure of the USD/CAD bulls to break through the orange 200 exponential average are extremely significant. This example shows the importance of the moving averages for the price dynamics of trading instruments. Therefore, the author puts the major focus on them in reviews. Besides, it is necessary to specify a strong technical level of 1.2900 where bulls have serious problems. During the previous week's trading the pair faced strong resistance trying to overcome the 200 EMA. Then it turned southward, fell to the bottom boundary of the Ichimoku cloud and broke the blue Kijun line. During the current five-day trading session, the pair has already withdrawn from the weekly cloud. If the trading ends below its lower boundary, the pair's bearish sentiment will definitely strengthen. However, it is recommended to take the blue 50 simple moving average into account at 1.2535. It may provide support, triggering the pair's rebound. If the 50 simple moving average fails to hold bears' pressure, bulls will face serious difficulties. In this case strong support will be available at 1.2450.
Daily
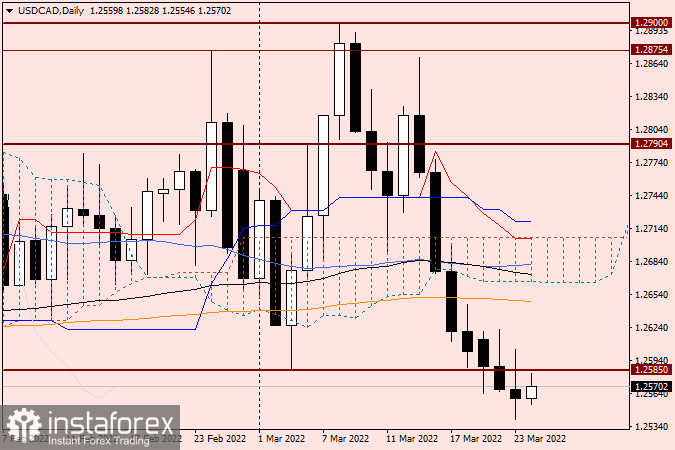
A bearish scenario is clearly visible on the daily chart. Firstly, the pair has already overcome all the indicators and consolidated below them. Secondly, a real breakout occurs at the significant support level of 1.2585. Only two daily candlesticks have closed below it so far. However, attempts to consolidate above this level failed. Therefore, the breakout of 1.2585 is considered real due to this fact. However, the closing of today's trading will clarify the situation. If the third successive daily candlestick closes below 1.2585, the breakout will definitely be real. Considering both timeframes, it is recommended to sell the pair after it attempts to resume above 1.2585 as well as rises above 1.2600-1.2640. To buy the pair, it is advisable to monitor specific candlestick signals on the daily chart or on the weekly chart.
Good luck!


