


Conditions for opening long positions on EUR/USD:
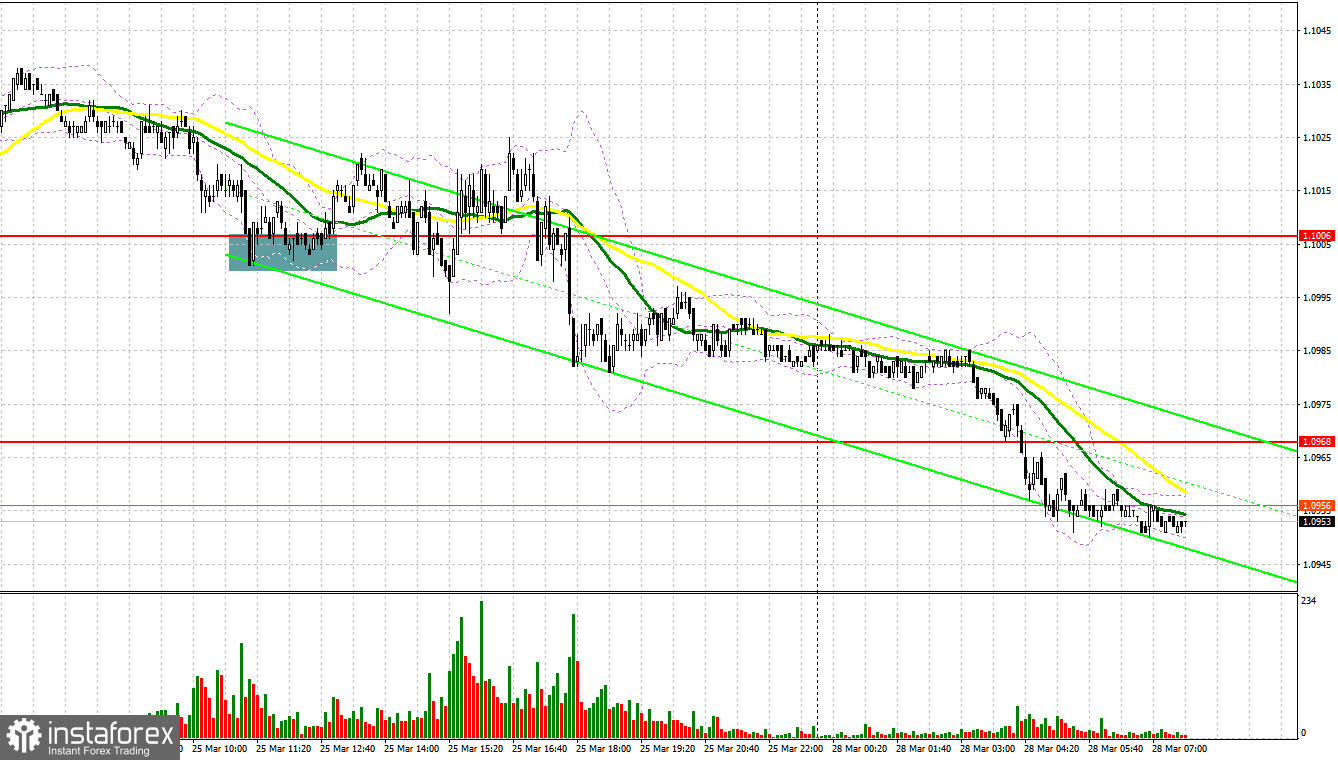
On Friday, traders received just one signal to enter the market. Let us take a look at the 5-minute chart to analyze the market situation. Earlier, I asked you to focus on 1.1006 to decide when to enter the market. Germany published weak reports prepared by the Ifo institute, thus disappointing traders. The data turned out to be significantly worse than expected. Against this background, the euro dropped to the support level of 1.1006, where we saw a false break, which gave a buy signal. However, the euro increased just by 20 pips. In the second part of the day, the currency broke 1.1006, thus causing a slump.
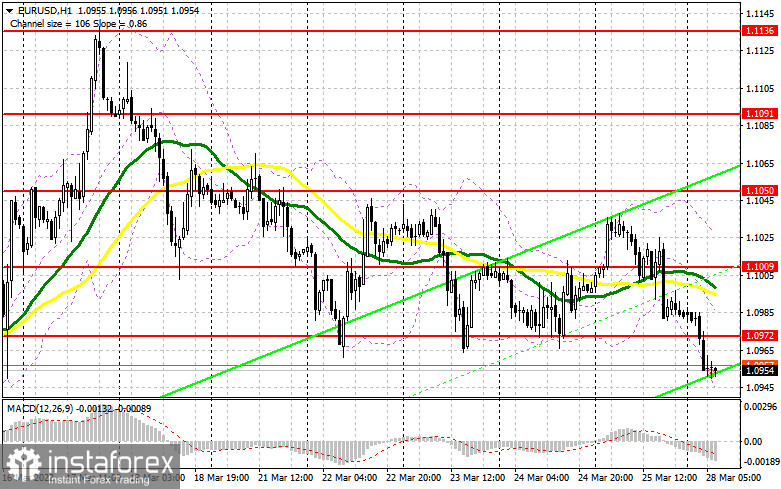
At the moment, buyers of the euro have rather grave problems. During the Asian trade, the euro/dollar pair lost control over the level of 1.0972. Now, it has every chance to tumble to the low recorded on March 15. That is why the market sentiment may change to the bearish one. To avoid this, bulls should regain control over the level of 1.0972 as fast as possible. The fact is that more and more Fed's representatives are supporting a more aggressive approach to the monetary policy tightening. This, in turn, is boosting the US dollar and exerting pressure on risk assets. A zero progress in the Russian-Ukraine negotiations, which should continue early this week, is also limiting the number of long positions on the euro. If the pair continues falling, buyers will have to protect the support level of 1.0928. It is a key level that may determine the future movement of the asset. Since today, the macroeconomic calendar is empty, buyers will hardly receive a signal to enter the market. It means that the pair may slide to 1.0928 very fast. Only a false break of this level will provide traders with a strong buy signal. To surge, the euro/dollar pair should return to 1.0972 amid high bullish activity. In case of a downward test of the level, traders will get a sell signal, thus allowing the pair to touch 1.1009. It is better to lock in profits at this level. If the pair upwardly breaks this level, the bearish trend is likely to stop, allowing the price to climb to the highs of 1.1050 and 1.1091. If the pair slumps and bulls fail to protect 1.0928, it will be wise not to open long positions. It will be possible to buy the asset after a false break of the low of 1.0891. Traders may also go long from 1.0855, expecting a rise of 30-35 pips within the day.
Conditions for opening short positions on EUR/USD:
After a decline during the Asian trade, bears continue controlling the market. Expectations of a more aggressive monetary policy of the US Fed are again of primary importance. The fact is that most market participants are deeply concerned about inflationary pressure. First of all, sellers should protect the nearest resistance level of 1.0972. A false break of this level will boost pressure on the euro and give a sell signal with the target at the support level of 1.0928. In the first part of the day, the macroeconomic calendar is empty. It means that buyers will hardly be active at 1.0928. An upward test of this level may give an additional signal to open short positions with the target at 1.0891. A farther target is located at 1.0755 where it is recommended to lock in profits. If the euro rises and bears fail to protect 1.0972, bulls will try to return to the market. A close above this level will point to a sideways trading. In this case, the market sentiment will hardly become bearish. That is why traders should be very cautious. It is better to open short positions after a false break of 1.10009. Traders may also sell the asset from 1.1050 or 1.1091, expecting a decline of 20-25 pips.
Commitment of Traders Report
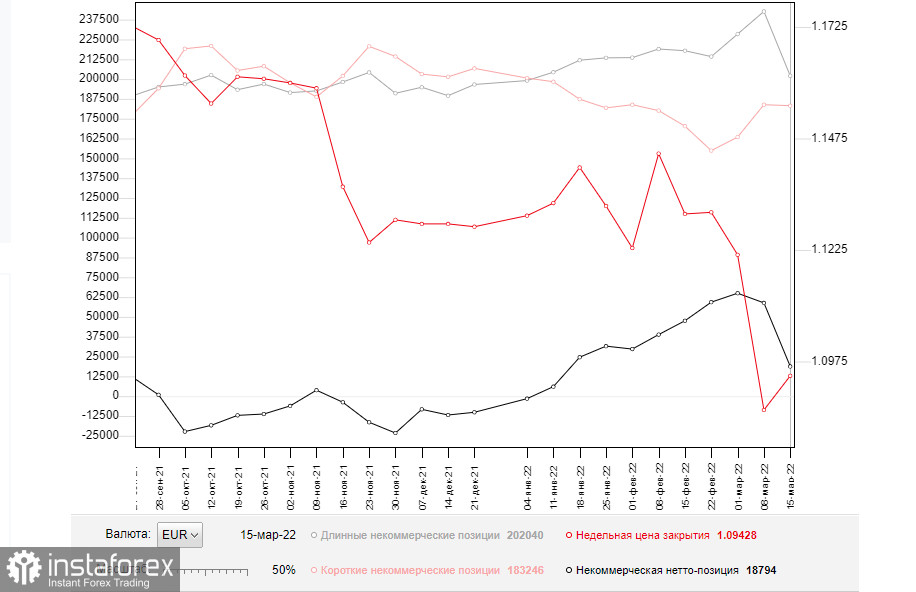
According to the COT report from March 15, the number of long and short positions dropped. However, a decline in the number of short positions was insignificant, whereas the number of long positions slumped. Such a considerable decrease was mainly caused by the special military operation in Ukraine. The Fed's meeting was the main event of the previous week. The regulator raised the benchmark rate by 0.25%. However, the decision did not affect the market since traders had priced in such a result long ago. Notably, Fed Chair Jerome Powell took the wait-and-see approach during the press conference. He did not announce a more aggressive approach, thus boosting the number of long positions on risk assets. However, early this week, the Fed Chair changed his approach, emphasizing that the key interest rate could be raised by 0.5% at the following meeting. It is a strong bullish signal for the US dollar, which is highly likely to go on climbing against the euro.
Not so long ago, the ECB also held a meeting, where Christine Lagarde announced the central bank's plans for a faster QE tapering and key interest rate hike. It is good for the euro's mid-term future since the currency is significantly oversold against the greenback. According to the COT report, the number of long non-commercial positions declined to 202,040 from 242,683. Meanwhile, the number of short non-commercial positions dropped to 183,246 from 183,839. The weekly close price inched up to 1.0942 from 1.0866.
Signals of indicators:
Moving Averages
Trading is conducted just below the 30- and 50-day moving averages, which indicates that bears are still controlling the market. .
Note: The period and prices of moving averages are considered by the author on the one-hour chart that differs from the general definition of the classic daily moving averages on the daily chart.
Bollinger Bands
If the price rises, the upper limit of the indicator located at 1.1020 will act as a resistance level. In case of a decline, the lower limit of 1.0940 will act as a support level.
Description of indicators
- Moving average (moving average, determines the current trend by smoothing volatility and noise). The period is 50. It is marked in yellow on the chart.
- Moving average (moving average, determines the current trend by smoothing volatility and noise). The period is 30. It is marked in green on the graph.
- MACD indicator (Moving Average Convergence/Divergence - convergence/divergence of moving averages). A fast EMA period is 12. A slow EMA period is 26. The SMA period is 9.
- Bollinger Bands. The period is 20.
- Non-profit speculative traders are individual traders, hedge funds, and large institutions that use the futures market for speculative purposes and meet certain requirements.
- Long non-commercial positions is a total number of long position opened by non-commercial traders.
- Short non-commercial positions is a total number of short position opened by non-commercial traders.
- The total non-commercial net position is a difference in the number of short and long positions opened by non-commercial traders.


