


Analysis of Monday's trades:
30M chart of GBP/USD
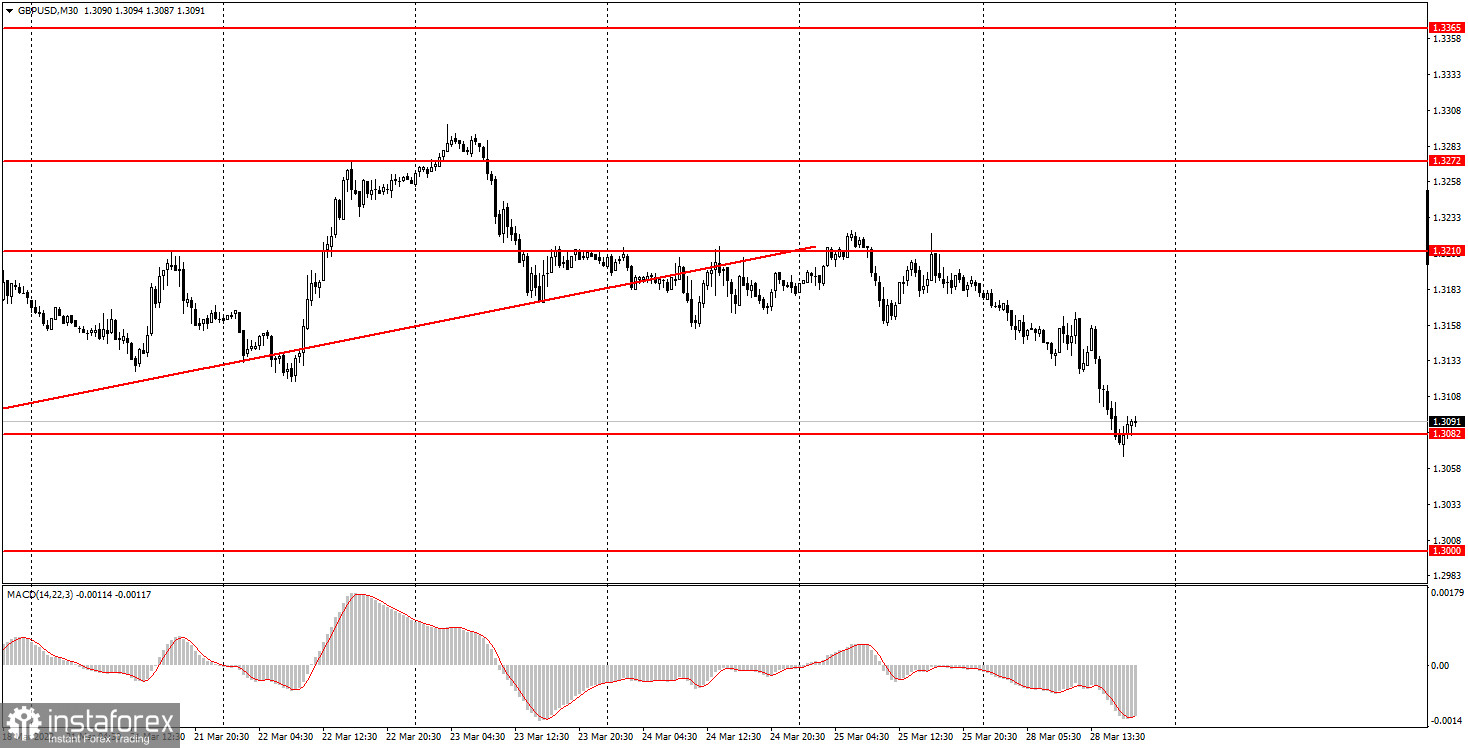
The GBP/USD pair traded rather nicely on Monday, showing a strong movement during the Asian and North American sessions. Meanwhile, during the European session, the market was flat. Overall, the British currency fell by 90 pips on Monday although there had been no reasons for that. Governor Andrew Bailey's speech contained no new information. However, the pound had started to go down long before that. So, unlike the euro, the sterling incurred losses on Monday. It turns out both currencies started the new trading week trying to resume the downtrend, which means traders are still shifting away from risk assets towards the safe-haven dollar. The fundamental and macroeconomic backgrounds have no influence on the market right now. From the technical point of view, the price settled below the ascending trend line, which explains the fall in the pound.
5M chart of GBP/USD
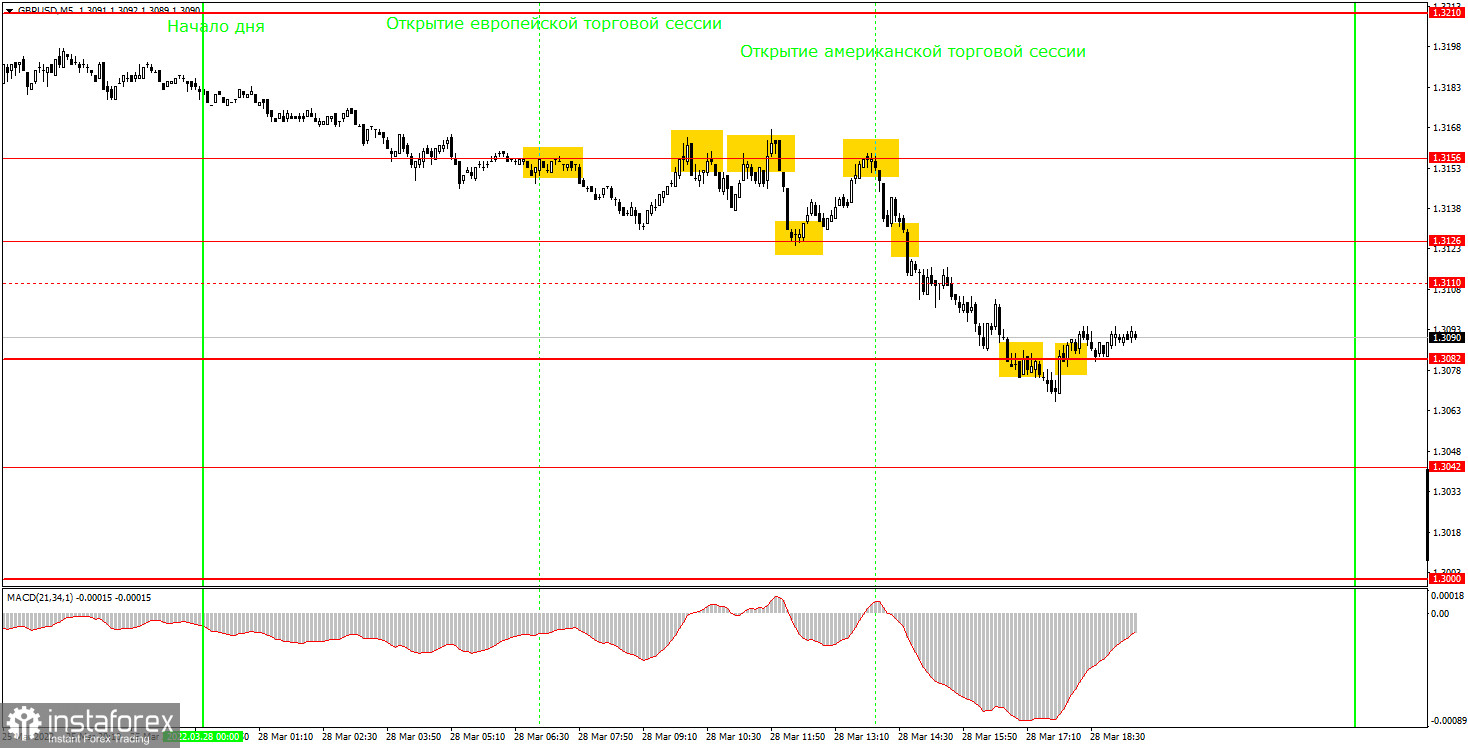
In the M5 time frame, the technical picture would look excellent on Monday if not for the flat market during the European session. All that time, the price hovered in the range between 1.3126 and 1.3156, producing trading signals near these levels. So, let's analyze them now. Four sell signals were made at around 1.3156 and the target level of 1.3126 was reached just twice. Therefore, traders were able to open only two sell trades. However, they had no reason to close these positions because Stop Loss hadn't been triggered and the price had failed to consolidate above 1.3156. Consequently, when the quote fell to 1.3126 for the first time, sell trades could have been closed and a buy trade should have been opened, and vice versa near the 1.3561 level. The second short position should have been closed at around 1.3082 after the price had settled above it. The first two trades could have brought traders some 20 pips of a profit because of the flat market at that time. Beginners could have made about 50 pips of a profit from the third trade. The last buy signal at around 1.3082 was made too late, so it should have been ignored.
Trading plan for Tuesday:
In the 30M time frame, the pair settled below the ascending trend line. Its downward move continues now. The sterling needs to break through 1.3082 to extend its bear run. However, it could somewhat retrace up before it happens. Although neither the fundamental background nor the geopolitical one supports the pound, its downtrend could be prolonged and deep. On Monday, the target levels in the 5M time frame are seen at 1.3000, 1.3042, 1.3082, 1.3126, 1.3156, and 1.3210. A stop-loss order should be set at the breakeven point as soon as the price passes 20 pips in the right direction after a trade has been opened. No important macro events are to unfold in the US and the UK on Tuesday. Meanwhile, secondary macro reports are unlikely to cause any turbulence in the market.
Basic principles of the trading system
1) The strength of the signal depends on the time period during which the signal was formed (a rebound or a break). The shorter this period, the stronger the signal.
2) If two or more trades were opened at some level following false signals, i.e. those signals that did not lead the price to the Take Profit level or the nearest target levels, then any consequent signals near this level should be ignored.
3) During the flat trend, any currency pair may form a lot of false signals or do not produce any signals at all. In any case, the flat trend is not the best condition for trading.
4) Trades are opened in the time period between the beginning of the European session and until the middle of the American one when all deals should be closed manually.
5) We can pay attention to the MACD signals in the 30M time frame only if there is good volatility and a definite trend confirmed by a trend line or a trend channel.
6) If two key levels are too close to each other (about 5-15 pips), then this is a support or resistance area.
How to interpret charts:
Support and resistance levels can serve as targets when buying or selling. You can place Take Profit near them.
Red lines are channels or trend lines that display the current trend and show which direction is better to trade.
MACD indicator (14,22,3) is a histogram and a signal line showing when it is better to enter the market when they cross. This indicator is better to be used in combination with trend channels or trend lines.
Important speeches and reports that are always reflected in the economic calendars can greatly influence the movement of a currency pair. Therefore, during such events, it is recommended to trade as carefully as possible or exit the market in order to avoid a sharp price reversal against the previous movement.
Beginner traders should remember that every trade cannot be profitable. The development of a reliable strategy and money management is the key to success in long-term trading.


