


EUR/USD 5M
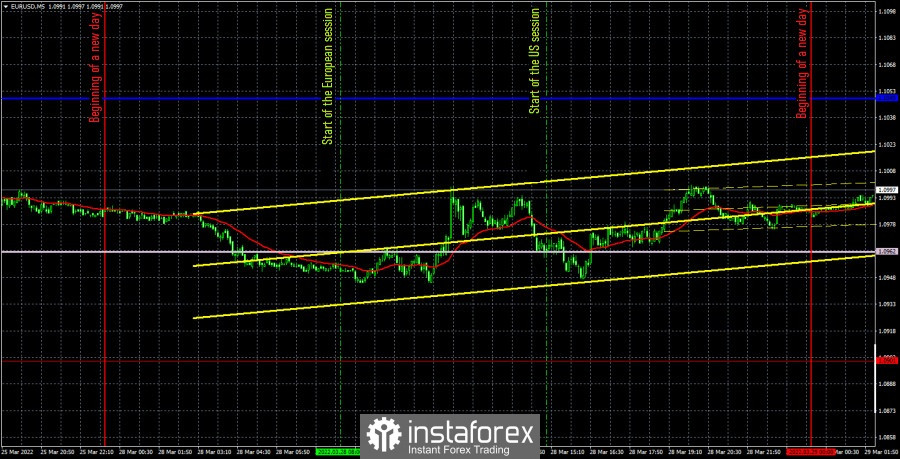
The EUR/USD pair was trading exclusively in the flat on Monday.This is clearly seen in the chart above. Both linear regression channels are directed sideways, but, in principle, even without them, it is perfectly clear that the pair was moving within a limited range without a clear direction of movement. From our point of view, this is not surprising, since we did not expect any macroeconomic statistics and fundamental events on Monday. There was no geopolitical news that day either, but still the British pound found the strength to start a new round of downward trend movement, while the euro did not. Thus, we believe that the downward trend continues for the euro/dollar pair. Monday can be considered an exception to the rule, but in general, the euro/dollar may trade mostly sideways for some time.
As for trading signals, there were none yesterday. The pair showed daily volatility equal to 53 points, which is not much even for the euro. We used the Senkou Span B and Kijun-sen lines as the boundaries of the horizontal channel, but the price still settled below Senkou Span B during the day. Since there was no rebound from it, it became clear that this boundary is no longer relevant. However, this did not completely negate the fact that the pair may trade for some time without a certain direction. As a result, we believe that we should not have entered the market yesterday. The probability of a "boring Monday" was too high.
COT report:
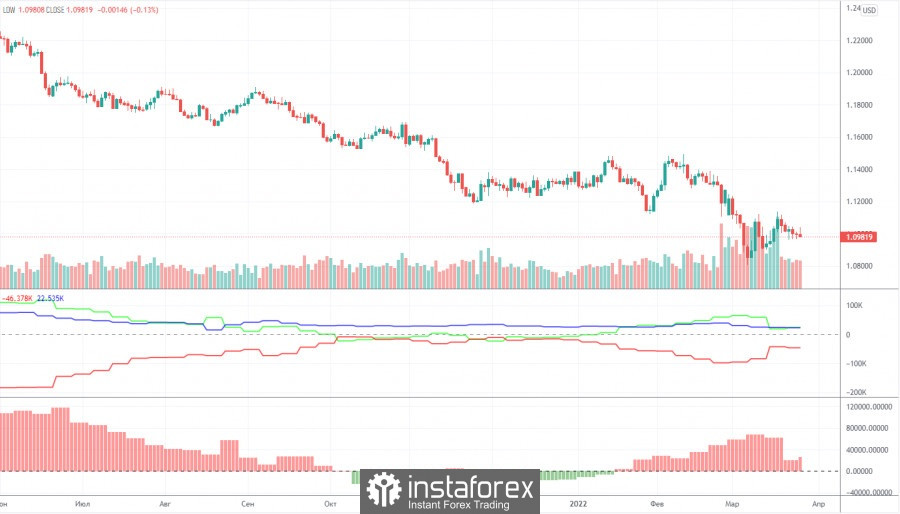
In the last two months, Commitment of Traders (COT) reports have signaled such changes in the mood of traders, which absolutely did not correspond to what was actually happening in the foreign exchange market. However, in the last two weeks, COT reports have at least begun to coincide a little with what is happening in the foreign exchange market. The major players in the last reporting week greatly reduced their net position, thanks to the meetings of the European Central Bank and the Federal Reserve, the results of which were very eloquent. This week, professional traders opened 5,000 long positions and closed 38 short positions. That is, the net position has increased by 5,000 contracts. Formally, the bullish mood, which remains exactly bullish, has slightly intensified. But look at the chart of the pair's movement in the chart above: the euro does nothing but fall. In this way, the euro is now only capable of local technical corrections. Fundamental and geopolitical factors have a huge impact on the market, so we do not believe that traders now have a reason to buy the euro currency. Therefore, the non-commercial group of traders can buy euros, sell euros, all the same, with the current foundation and geopolitics, the US dollar will grow. This is due to the fact that the COT report on the euro currency does not take into account changes in demand for the dollar itself. That is, it is reasonable to assume that the demand for the US currency is growing at a faster pace than the demand for the EU currency.
We recommend to familiarize yourself with:
Overview of the EUR/USD pair. March 29. The world needs peace. The euro currency also needs peace.
Overview of the GBP/USD pair. March 29. The British pound also did not remain in thought for long. A new fall has begun.
Forecast and trading signals for GBP/USD on March 29. Detailed analysis of the movement of the pair and trading transactions.
EUR/USD 1H
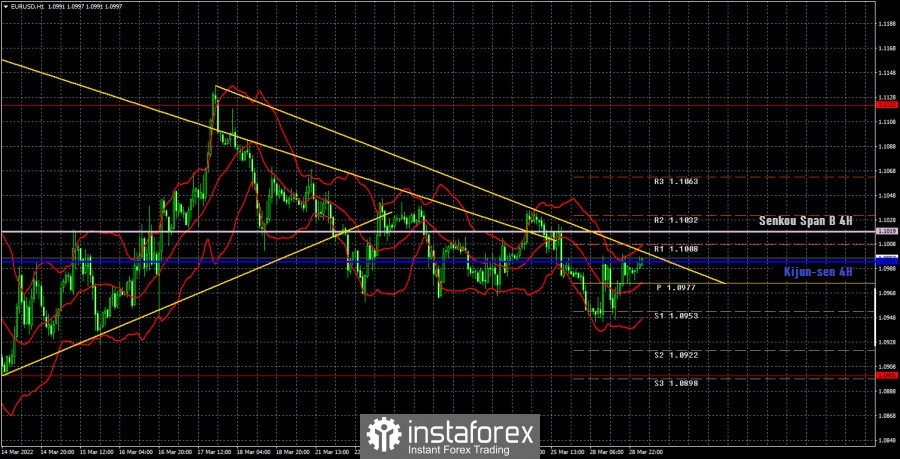
Both trend lines have already been canceled on the hourly timeframe, but a new descending trend line has also been formed, which again supports the bears. Whatever movements the pair shows at this time, the downward trend persists. Almost all factors speak in favor of the growth of the US currency, starting with "macroeconomics'' and ending with geopolitics. Therefore, since the price is now already below the lines of the Ichimoku indicator, we believe that the probability of a new fall is still higher than other options. However, if there is a consolidation above the Ichimoku lines, the pair may start flat again. And if above the trend line - there will be small chances of an upward trend. We allocate the following levels for trading on Tuesday - 1.0806, 1.0901, 1.1122, 1.1234, as well as the Senkou Span B (1.1019) and Kijun-sen (1.0994) lines. The lines of the Ichimoku indicator can move during the day, which should be taken into account when determining trading signals. There are also support and resistance levels, but no signals will be formed near them. Signals can be "bounces" and "breakthrough" levels - extremes and lines. Do not forget about placing a Stop Loss order at breakeven if the price went in the right direction of 15 points. This will protect you against possible losses if the signal turns out to be false. The calendars of macroeconomic events in the United States and the European Union are completely empty on March 29. The horizontal channel, which we talked about yesterday, has already left, but it can continue to move in the most flat-like movement. We believe that it is safe to consider short positions below the lines of the Ichimoku indicator.
Explanations for the chart:
Support and Resistance Levels are the levels that serve as targets when buying or selling the pair. You can place Take Profit near these levels.
Kijun-sen and Senkou Span B lines are lines of the Ichimoku indicator transferred to the hourly timeframe from the 4-hour one.
Support and resistance areas are areas from which the price has repeatedly rebounded off.
Yellow lines are trend lines, trend channels and any other technical patterns.
Indicator 1 on the COT charts is the size of the net position of each category of traders.
Indicator 2 on the COT charts is the size of the net position for the non-commercial group.


