


Let the market find the direction first
Before giving the forecast for today, let us first discuss the technical picture for USD/CHF on the weekly chart on March 21-25.
Weekly chart
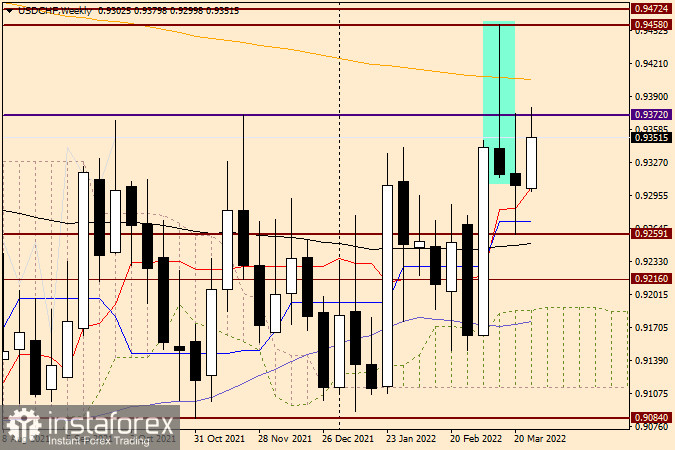
Given that both the currencies are considered protective assets, the US dollar does not have such a clear advantage over the Swiss franc as it has over the Japanese yen. A marked candlestick that was formed in the previous week reasonably suggested a decline in quotes that was actually in place until the end of the weekly session. However, it is worth paying attention to the long shadows of the last weekly candlestick. They clearly indicate that there is a tough struggle between sellers and buyers. The USD/CHF bulls once again attempted to break through the strong resistance at 0.9372 but failed to succeed. Bears, on the other side, failed to settle near the reached low of 0.9259 and performed a strong upside rebound from this level. Such a fierce fight and high volatility show that the further direction of the pair is highly uncertain now.
At the moment of writing, the pair is trading under bullish control. Yet, another attempt to overcome the resistance at 0.9372 caused a strong rebound from this technical level. Even if bulls manage to push the quote above 0.9372, they will face strong resistance of the orange 200 EMA, which may easily reverse the price to the downside. So, a strong bounce from the 200 EMA will be hardly surprising. As I have already mentioned in my previous reviews, the final victory of the bulls will be a breakout of key resistance levels of 0.9458 and 0.9472 and consolidation above the significant historical, technical and psychological level of 0.9500. Meanwhile, bears will need to retest the previous low at 0.9259 and close this week under this level. I believe that the previous rebound from 0.9259 was largely facilitated by the Tenkan line and the blue Kijun line of the Ichimoku indicator.
Daily chart
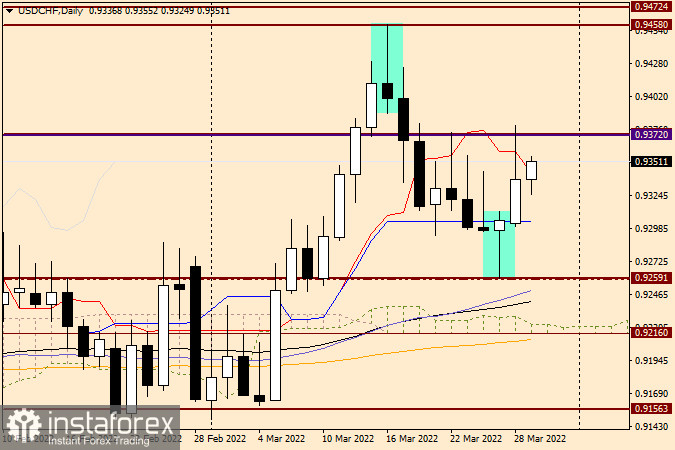
On the daily chart, the technical picture is gradually becoming bullish. The Hammer reversal candlestick pattern formed on March 25 confirms the trend as it has a bullish body and a very long lower shadow. Just before this, the market had formed the Inverted Hammer candlestick pattern with a small bearish body. Yesterday, the pair showed impressive growth but faced a strong obstacle at the resistance level of 0.9372. As you can see, yesterday's candlestick has a rather long upper shadow. Yet, this does not discourage buyers from making news attempts. At the moment, the pair is trying to break through the red daily Tenkan line. The breakout of this level will return the quote to its daily high at 0.9380.
Such persistence of the USD/CHF bulls is an indication of an upward scenario which suggests buying the pair. However, it may not be the best idea to open long positions under a strong resistance level. To reduce the risk, I suggest waiting for a short-term decline to the area of 0.9335 and to enter the market from there. Another idea for opening buy trades would be an actual breakout of the resistance level of 0.9372 and consolidation above this mark. If bearish reversal candlestick patterns begin to appear below this level on lower time frames, this will serve as a signal to sell USD/CHF. Considering the tough opposition of the two sides, I do not recommend setting big targets in any chosen scenario. Let the market find the direction first.
Good luck!


