


Analyzing trades on Tuesday:
EUR/USD on 30M chart
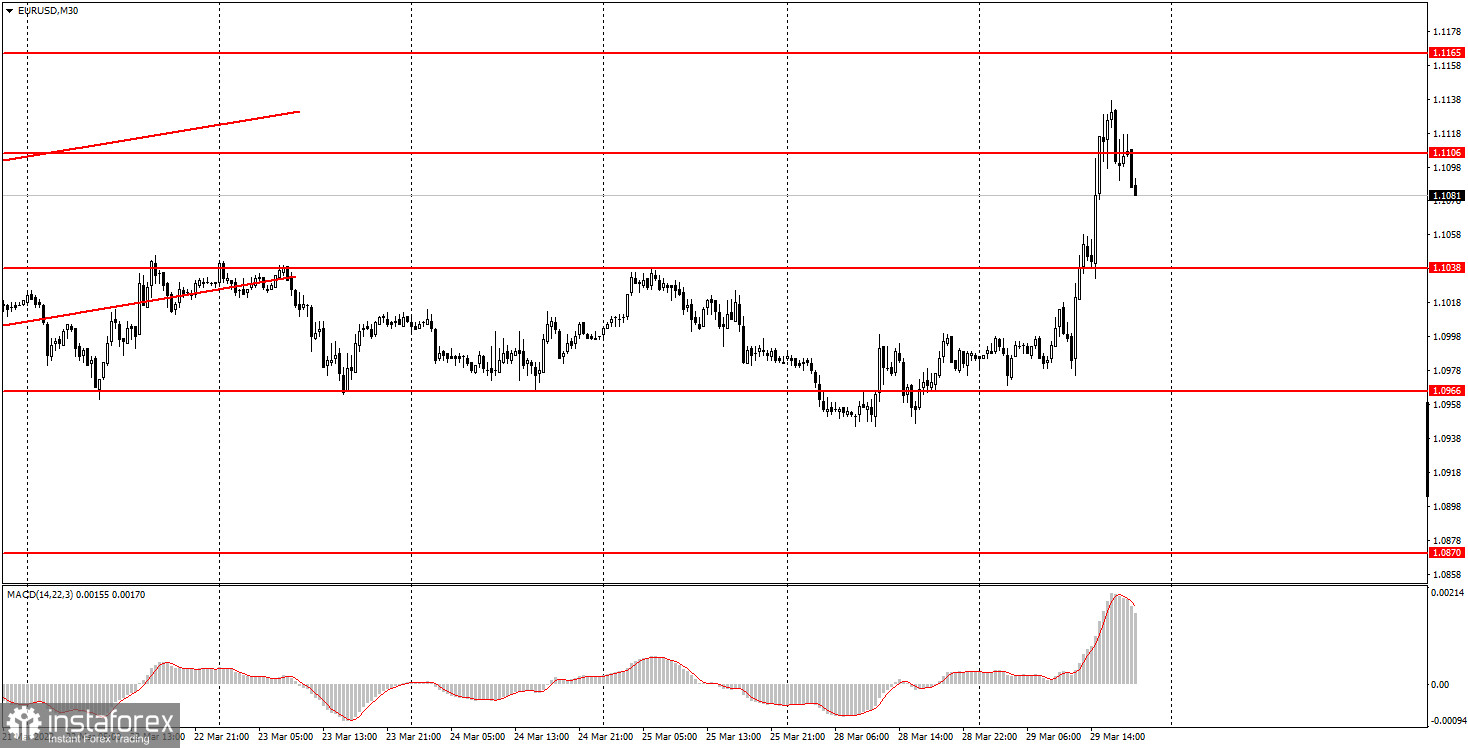
EUR/USD saw robust trading on Tuesday and managed to gain 140 pips. Such a strong movement was provoked by an event not connected with macroeconomics in any way. Another round of talks between Ukraine and Russia has taken place in Turkey and gave hope for some positive changes. Kyiv and Moscow noted that negotiations moved from the dead point and may soon result in a peace agreement. Some issues still need to be discussed, but consensus can also be reached on them. It was also reported that Russian troops were retreating from Kyiv and Chernihiv. Naturally, markets immediately reacted to this information. Earlier, the euro and the pound fell amid the escalation of the military conflict, but on Tuesday, they showed a reversal. Unfortunately, it was very difficult to predict this move since no one knew how the negotiations would end. Besides, chances were slim that any significant progress could be made. We have repeatedly warned you in our previous reviews that the geopolitical factor must be taken very seriously.
EUR/USD on 5M chart
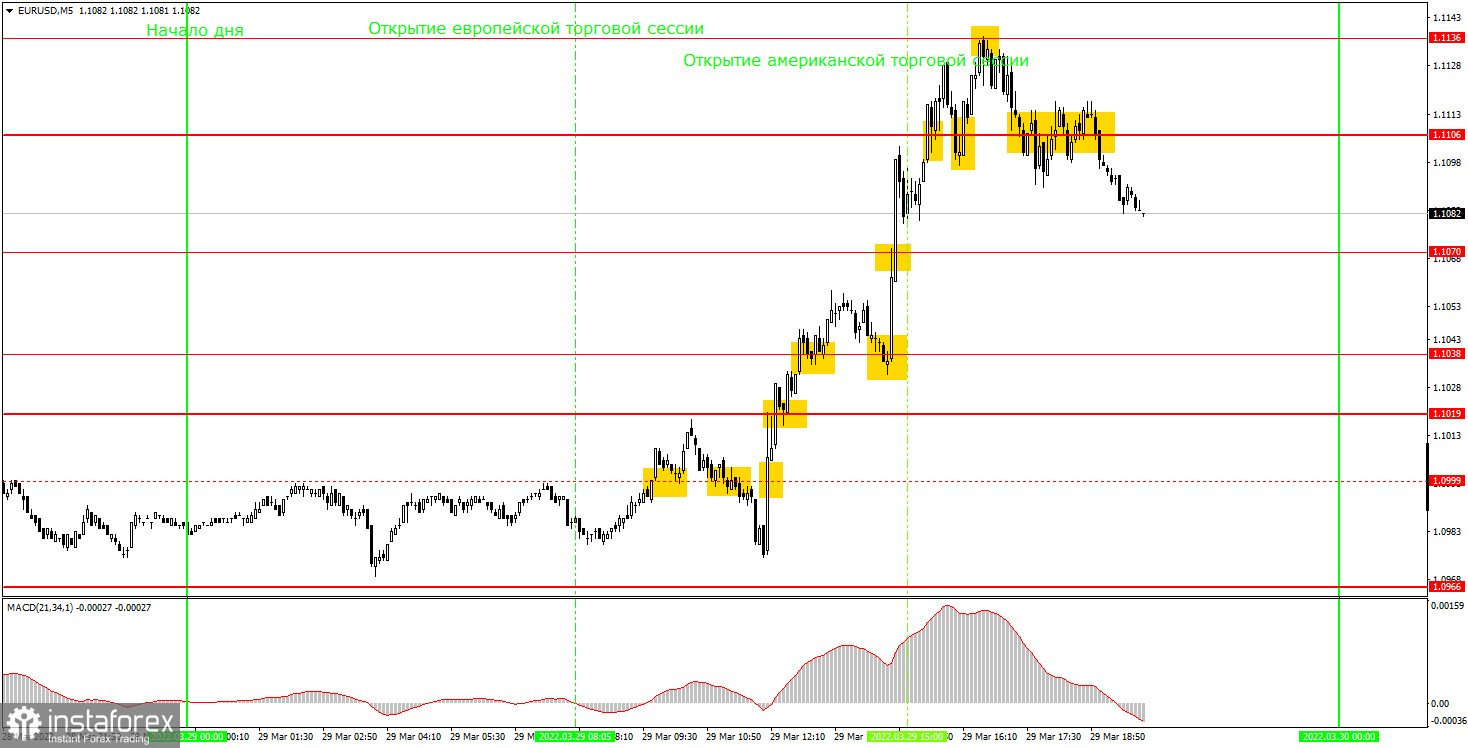
On the 5-minute time frame, we saw a lot of trading signals formed. Since the volatility was very high, the pair tested several levels. Let's try to figure out what was the best strategy to use on Tuesday. At first, trading was sluggish. The price has formed three trading signals near the level of 1.0999. The first should have been ignored since the price had already reached the next level of 1.1019 at the time of its formation. The second sell signal could have been followed, but the short position was closed by a Stop Loss at breakeven as the price went down by about 20 pips. The third signal should not have been followed at all since at that time, there were already two false signals near 1.0999. But then everything changed. There was a buy signal near the level of 1.1019 which could be used to open a long position. After that, the pair jumped by 100 pips, breaking through a bunch of levels along the way. Therefore, a buy trade should have been closed only after a rebound from the level of 1.1136. Then, traders could have opened a new short position straight away, which should have been closed manually in the evening near the level of 1.1070. Thus, there were a lot of signals but only 4 trades were opened. The last two allowed traders to earn at least 100 pips in profit.
Trading tips on Wednesday
On the 30-minute time frame, the pair has rapidly started a new uptrend, which can end quite quickly. There is no clear trend on this time frame right now, and all the movements were unstable in nature. This means that the market panicked and reacted to a very important event. Based on this movement, it is impossible to analyze the technical picture, build trends or make forecasts. Now the market needs to calm down after a crazy Tuesday. On the 5-minute chart on Wednesday, it is recommended to trade at the levels 1.1019, 1.1038, 1.1070, 1.1106, 1.1136, and 1.1168. You should set a stop loss order to breakeven as soon as the price passes 15 pips in the right direction. On Wednesday, Christine Lagarde will make a statement, and the US will release the ADP and GDP reports. However, another round of talks in Turkey between Ukraine and Russia will also take place on Wednesday. Therefore, geopolitics may stay the most significant factor for the market.
Basic rules of the trading system
1) The strength of the signal is determined by the time it took the signal to form (a rebound or a breakout of the level). The quicker it is formed, the stronger the signal is.
2) If two or more positions were opened near a certain level based on a false signal (which did not trigger a Take Profit or test the nearest target level), then all subsequent signals at this level should be ignored.
3) When trading flat, a pair can form multiple false signals or not form them at all. In any case, it is better to stop trading at the first sign of a flat movement.
4) Trades should be opened in the period between the start of the European session and the middle of the US trading hours, when all positions must be closed manually.
5) You can trade using signals from the MACD indicator on the 30-minute time frame only amid strong volatility and a clear trend that should be confirmed by a trendline or a trend channel.
6) If two levels are located too close to each other (from 5 to 15 pips), they should be considered support and resistance levels.
On the chart
Support and Resistance Levels are the levels that serve as targets when buying or selling the pair. You can place Take Profit near these levels.
Red lines are channels or trend lines that display the current trend and show in which direction it is better to trade now.
The MACD indicator (14, 22, and 3) consists of a histogram and a signal line. When they cross, this is a signal to enter the market. It is recommended to use this indicator in combination with trend patterns (channels and trendlines).
Important announcements and economic reports that can be found on the economic calendar can seriously influence the trajectory of a currency pair. Therefore, at the time of their release, we recommend trading as carefully as possible or exiting the market in order to avoid sharp price fluctuations.
Beginners on Forex should remember that not every single trade has to be profitable. The development of a clear strategy and money management is the key to success in trading over a long period of time.


