


Analysis of previous deals:
30M chart of the GBP/USD pair
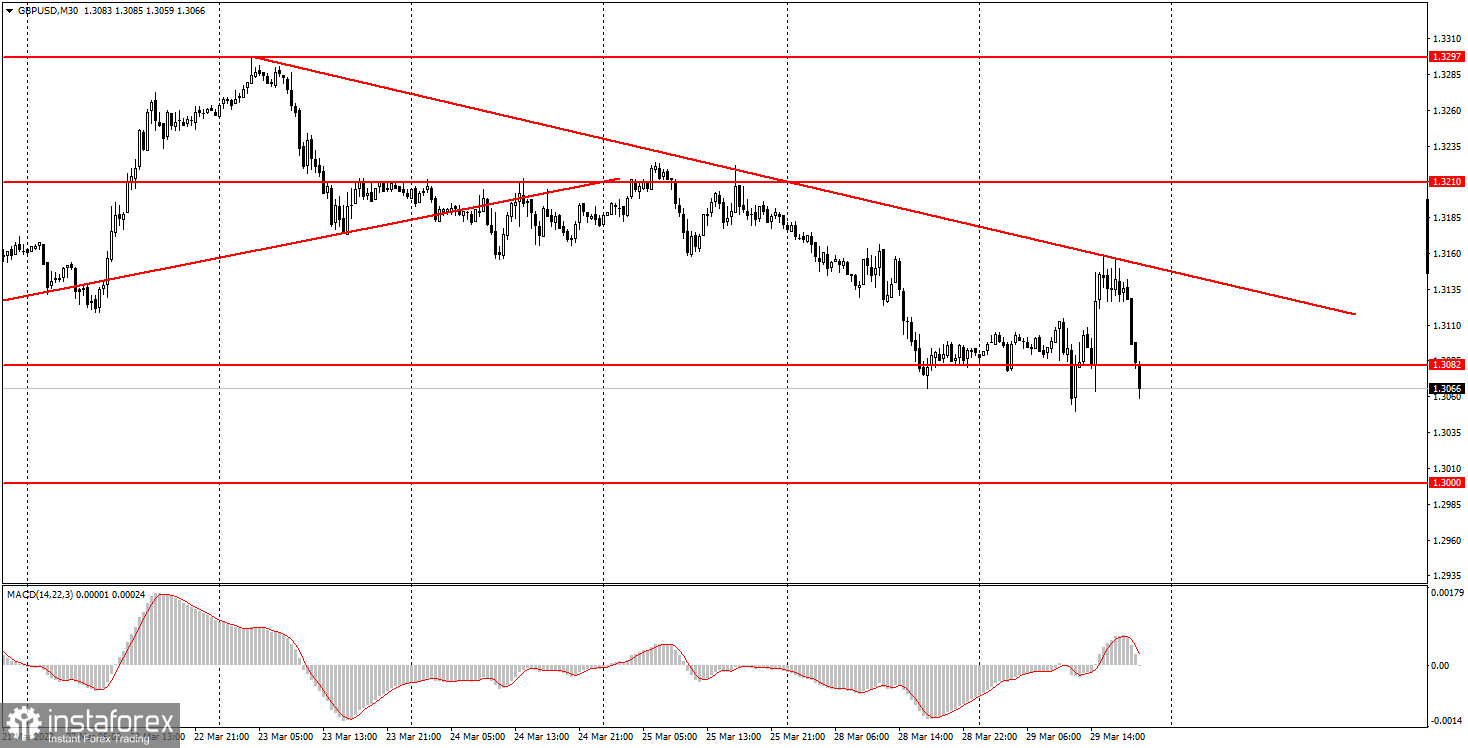
The GBP/USD pair was also trading very actively on Tuesday, but still much more modest than the EUR/USD pair. It is immediately necessary to divide the pair's entire movement into two periods: before the results of the negotiations between Ukraine and Russia were announced, and after that. Prior to that, the pound was trading with fairly low volatility and overcame the level of 1.3082, which should have been a signal for a new fall of the pair. However, after it became known about the high probability of concluding a peace agreement, the pound quotes soared sharply. However, they were there "at the top" for a very short time, as British Prime Minister Boris Johnson immediately made a statement that despite the possible withdrawal of Russian troops, this does not mean that all sanctions against Russia will now be lifted. Johnson suggested continuing to put pressure on Russia and personally on Vladimir Putin. Thus, if the conflict between Ukraine and Russia is sluggishly moving towards its possible conclusion, then the West–Russia conflict does not even think of de-escalating. That is why the pound crashed down again. Europe has not yet commented on the situation in Turkey, so the euro is still being held back from a new fall. Also, it was possible to form a strong trend line today, which now supports bears. The pound may continue to fall.
5M chart of the GBP/USD pair
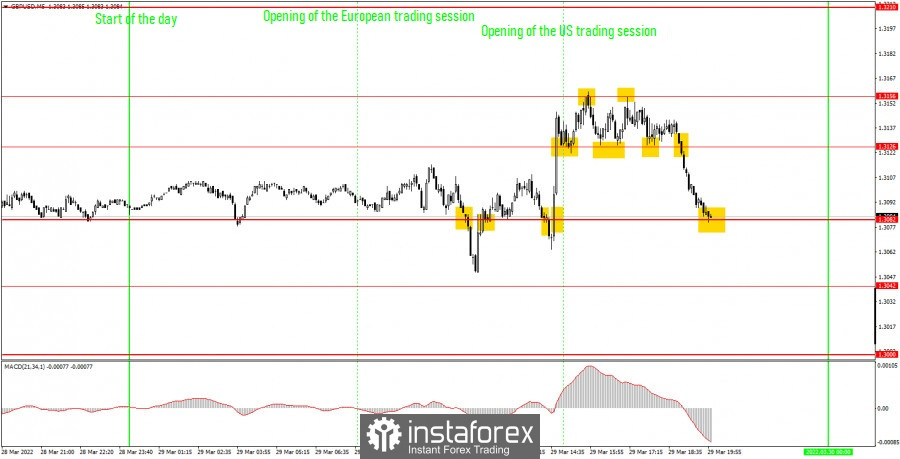
A lot of trading signals were generated on the 5-minute timeframe. Again, it is important to understand that before the information about the negotiations in Turkey were announced, the pair had to continue moving down. The signal about overcoming the level of 1.3082, however, should not have been worked out, since the price went down very quickly. But a buy signal near the level of 1.3082 could be worked out, but the deal closed at a Stop Loss at breakeven (the price went up 20 points). Then the pair began to openly storm. Two more signals near the level of 1.3082 should have been ignored, since at that time two false signals had already been formed near this level. The buy signal near the level of 1.3126 should also be ignored, since at the time of its formation, the price rested on the level of 1.3156. Then the price traded for some time between the levels of 1.3126 and 1.3156. Here it was possible to open three deals, each of which could bring no more than 10 points. Only the last sell signal near the level of 1.3126 brought a good profit, as the price began a very strong fall and on the way overcame the level of 1.3082. It was necessary to close this short position manually in the evening. It managed to earn about 50 points. Thus, today it mattered how novice traders filter out a huge number of trading signals. If everything was done wisely, then you could get a very decent profit today.
How to trade on Wednesday:
The pair maintains a downward trend on the 30-minute TF, and now there is also a downward trend line. Therefore, the pound can quite calmly continue to fall in the coming days and weeks. Until the price has settled above the trend line. Moreover, geopolitics is still very unstable and can turn in any direction at any moment. On the 5-minute TF, it is recommended to trade by levels 1.3000, 1.3042, 1.3082, 1.3126, 1.3156, 1.3210. When the price passes after the transaction has been opened in the right direction, 20 points should be set to Stop Loss at breakeven. There are no important events or reports scheduled for tomorrow in the UK. Quite important ADP and GDP reports will be released in the US, which may provoke a market reaction. However, a new round of negotiations between Ukraine and Russia will also take place tomorrow. Therefore, this event has even more chances to cause a strong movement.
Basic rules of the trading system:
1) The signal strength is calculated by the time it took to form the signal (bounce or overcome the level). The less time it took, the stronger the signal.
2) If two or more deals were opened near a certain level based on false signals (which did not trigger Take Profit or the nearest target level), then all subsequent signals from this level should be ignored.
3) In a flat, any pair can form a lot of false signals or not form them at all. But in any case, at the first signs of a flat, it is better to stop trading.
4) Trade deals are opened in the time period between the beginning of the European session and until the middle of the American one, when all deals must be closed manually.
5) On the 30-minute TF, using signals from the MACD indicator, you can trade only if there is good volatility and a trend, which is confirmed by a trend line or a trend channel.
6) If two levels are located too close to each other (from 5 to 15 points), then they should be considered as an area of support or resistance.
On the chart:
Support and Resistance Levels are the Levels that serve as targets when buying or selling the pair. You can place Take Profit near these levels.
Red lines are the channels or trend lines that display the current trend and show in which direction it is better to trade now.
The MACD indicator (14,22,3) consists of a histogram and a signal line. When they cross, this is a signal to enter the market. It is recommended to use this indicator in combination with trend lines (channels and trend lines).
Important speeches and reports (always contained in the news calendar) can greatly influence the movement of a currency pair. Therefore, during their exit, it is recommended to trade as carefully as possible or exit the market in order to avoid a sharp price reversal against the previous movement.
Beginners on Forex should remember that not every single trade has to be profitable. The development of a clear strategy and money management are the key to success in trading over a long period of time.


