


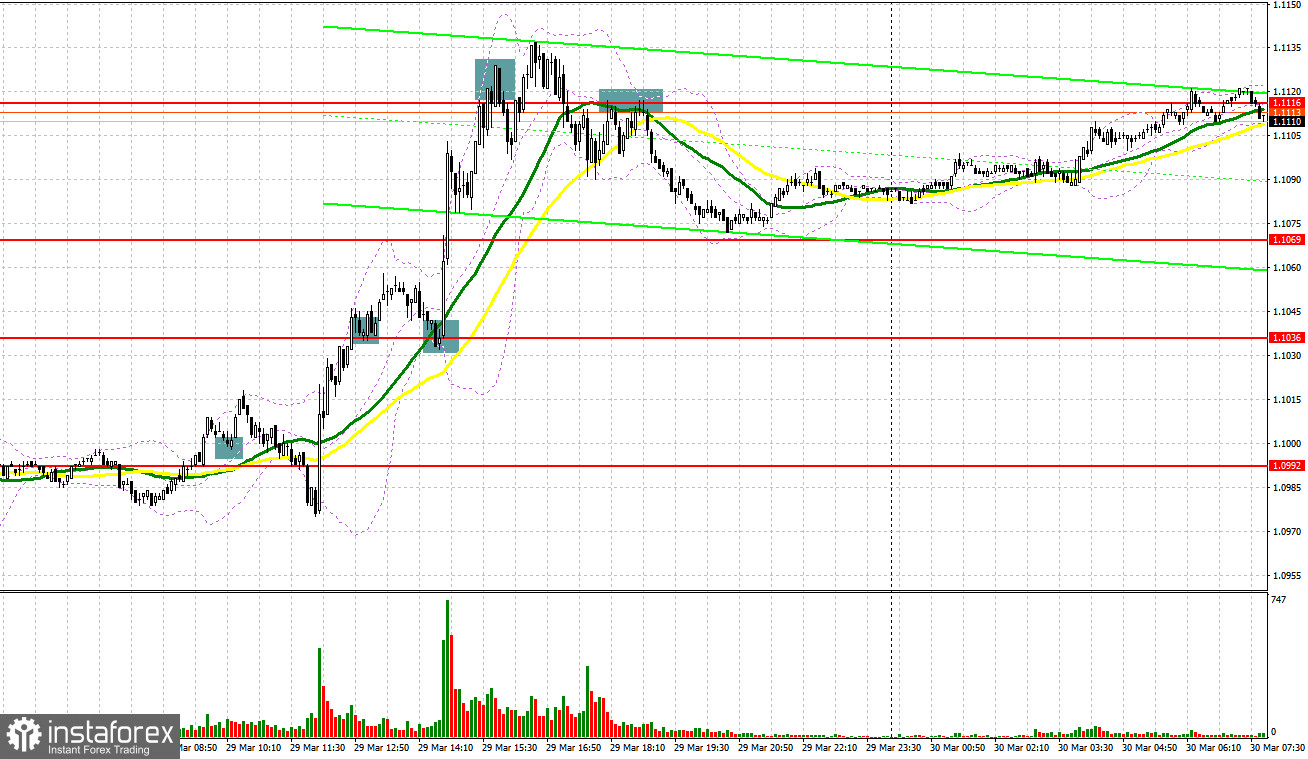
Earlier, I tried to draw your attention to the level of 1.0997 so that you could decide when to enter the market. Let us focus on the 5-minute chart to analyze the market situation. The absence of fundamental data led to a surge in volatility in the first part of the day. As a result, the euro/dollar pair consolidated above 1.0997. A downward test of this level provided traders with a long signal. However, the pair increased just by 20 pips. The second test of this level caused a decline in the pair. However, demand for risk assets climbed amid news about progress in the Russia-Ukraine talks. During the meeting, the parties settled some issues that may help to reach a truce. The euro reacted with a significant rise. Consolidation above 1.1036 and a downward test of the level gave a perfect long signal. As a result, the pair surged by more than 100 pips. A false break and return below 1.1116 provided traders with a good sell signal. The pair declined by 40 pips.
Conditions for opening long positions on EUR/USD:
Yesterday, Russian representatives said that the meeting was successful, whereas talks brought some results. There are rumors that the parties may reach a truce. In this case, the agreement is said to be signed by Vladimir Putin and Volodymyr Zelenskyy. Russia has also received written proposals from Ukraine confirming its desire for a neutral and nuclear-free status. This information boosted demand for risk assets, thus supporting the euro. Today, ECB President Christime Lagarde will provide a speech. She may confirm the regulator's intention to switch to a tighter policy. This may also support the euro in the short term. If the pair declines in the first part of the day, buyers will have to protect the intermediate support level of 1.1097. Only a false break of this level will give a strong long signal. Bulls should be very active near 1.1134 to push the pair to its highs recorded in March. Germany's consumer price index data may also encourage traders. The fact is that prices are likely to surge more than expected. This fact will become a bullish signal for the euro. That is why a downward break of 1.1134 may give a buy signal, thus allowing the pair to recover to 1.1181. Traders should lock in profits at this level. A break of this range may push the price to the highs of 1.1227 and 1.1271. If the pair declines and bulls fail to protect 1.1097, it will be better to avoid long positions. Traders should open buy orders after a false break of the low of 1.1062. It is also possible to buy the euro from 1.1033 or 1.1005, expecting a rise of 30-35 pips.
Conditions for opening sell positions on EUR/USD:
Bears are not planning to return to the market due to yesterday's political news. The fact is that demand for risk assets is gradually recovering, thus exerting pressure on the US dollar. Meanwhile, expectations of a more aggressive stance of the Fed is of minor importance now. Most market participants are concerned about a future geopolitical situation. Primarily, sellers should protect the nearest resistance level of 1.1134. A false break of this level may put the euro under pressure again and cause a sell signal with a target at the intermediate support level of 1.1097. However, the price will hardly break the level in the first part of the day because statistical data is likely to support buyers of the euro. Only an upward test of this level will give an additional signal to open sell orders with the target at 1.1062. A farther target is located at 1.1033, where it is recommended to lock in profits. If the euro rises and bears fail to protect 1.1134, the bullish trend is likely to continue. In this case, traders should avoid selling the euro. It will be better to open short order after a false break of 1.1181. It is also possible to sell the euro/dollar pair from 1.1227 or 1.127, expecting a decline of 20-25 pips.
COT report.
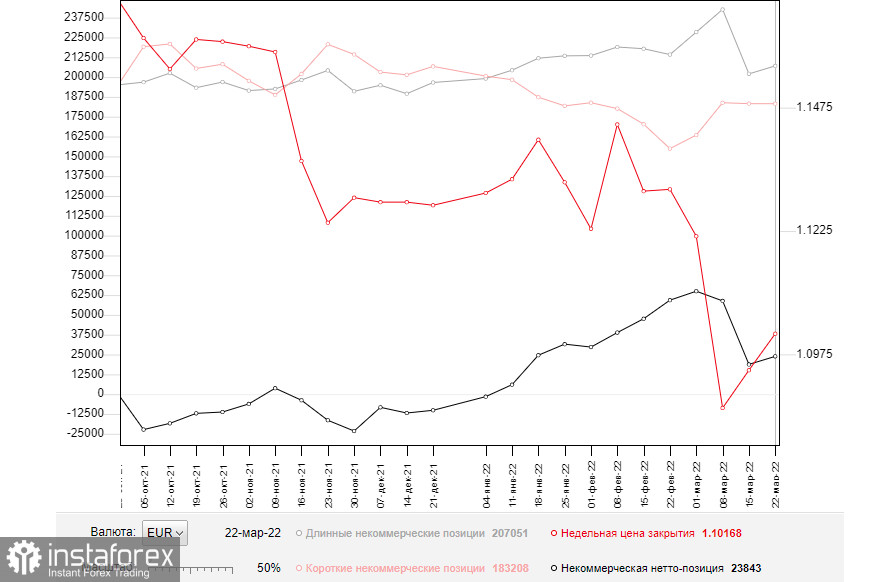
According to the COT report from March 22, the number of short positions declined, whereas the number of long positions soared. The pair's hovering near yearly lows and a strong support level had a positive effect on the euro. However, judging by the figures, a drop in the number of short positions was insignificant. Pressure on the euro/dollar pair returned after a small pause caused by Jerome Powell's announcement about a more hawkish stance of the Fed. On Monday, the Fed Chair said that the regulator was planning to raise the benchmark rate by 50 basis points at the following meeting. The same comments were provided by other representatives of the Federal Reserve. As a result, some market participants have revised their forecasts. The regulator has to resort to such sharp changes due to the risk of further inflation growth. Not so long ago, Christine Lagarde also unveiled the ECB's plan for a more aggressive QE tapering and the key interest rate hike. The news has a positive influence on the euro in the mid term. Notably, the single currency is significantly oversold against the US dollar. Good results of the Russia-Ukraine negotiations and lower geopolitical tension may encourage buyers of the euro. The COT report disclosed that the number of long non-commercial positions advanced to 207,051 from 202,040, whereas the number of short non-commercial orders declined to 183,208 from 183,246. A weekly close price inched up to 1.1016 from 1.0942.
Signals of indicators:
Moving Averages
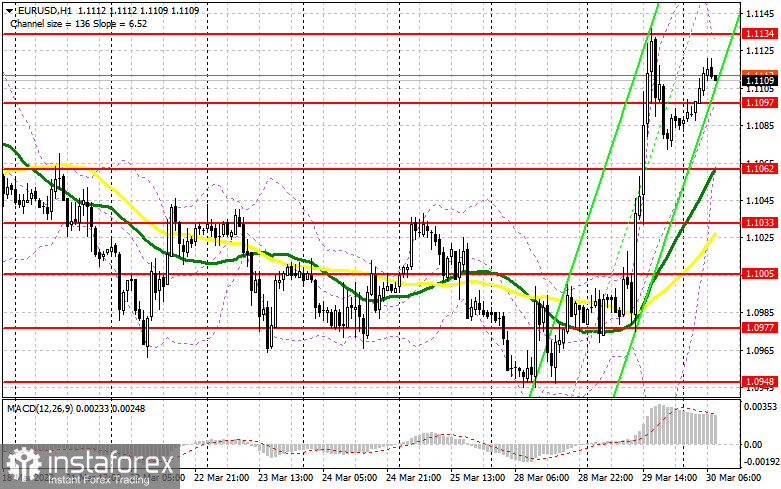
Trading is conducted just below the 30- and 50-day moving averages, which indicates that bears are still controlling the market. .
Note: The period and prices of moving averages are considered by the author on the one-hour chart that differs from the general definition of the classic daily moving averages on the daily chart.
Bollinger Bands
If the price rises, the upper limit of the indicator located at 1.1134 will act as a resistance level. In case of a decline, the lower limit of 1.1062 will act as a support level.
Description of indicators
- Moving average (moving average, determines the current trend by smoothing volatility and noise). The period is 50. It is marked in yellow on the chart.
- Moving average (moving average, determines the current trend by smoothing volatility and noise). The period is 30. It is marked in green on the graph.
- MACD indicator (Moving Average Convergence/Divergence - convergence/divergence of moving averages). A fast EMA period is 12. A slow EMA period is 26. The SMA period is 9.
- Bollinger Bands. The period is 20.
- Non-profit speculative traders are individual traders, hedge funds, and large institutions that use the futures market for speculative purposes and meet certain requirements.
- Long non-commercial positions is a total number of long positions opened by non-commercial traders.
- Short non-commercial positions is a total number of short positions opened by non-commercial traders.
- The total non-commercial net position is a difference in the number of short and long positions opened by non-commercial traders


