GBP/USD
Analysis:
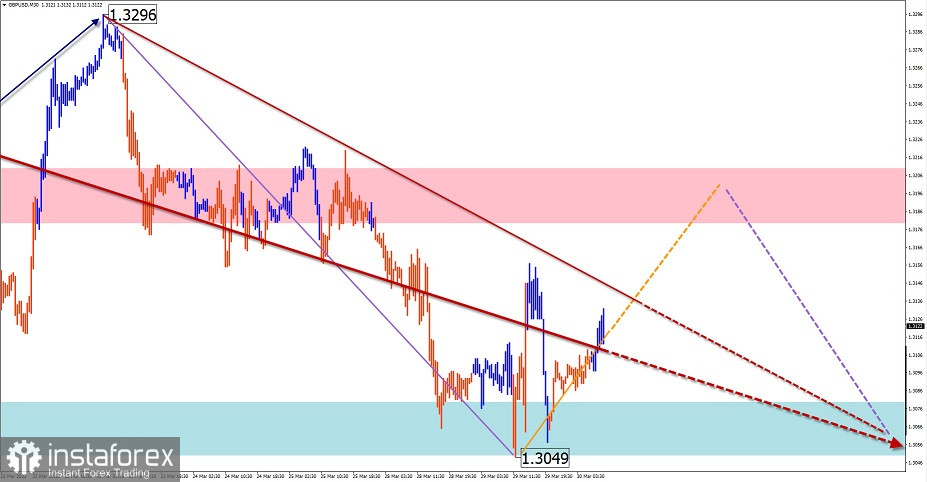
The downward trend continues on the chart of the British pound sterling. The unfinished section has been counting since March 23. In recent days, the price has been drifting sideways, forming a correction.
Forecast:
On the next day, the most likely sideways course of price movements is between the nearest zones of the opposite direction. After the probable pressure on the resistance, you can expect a reversal and a decline in the support area.
Potential reversal zones
Resistance:
- 1.3180/1.3210
Support:
- 1.3080/1.3050
Recommendations:
Trading activity in the British pound market is not recommended until the current upward pullback is completed. Sales will become possible after the appearance of sales signals confirmed by your vehicle in the area of the resistance zone.

AUD/USD
Analysis:
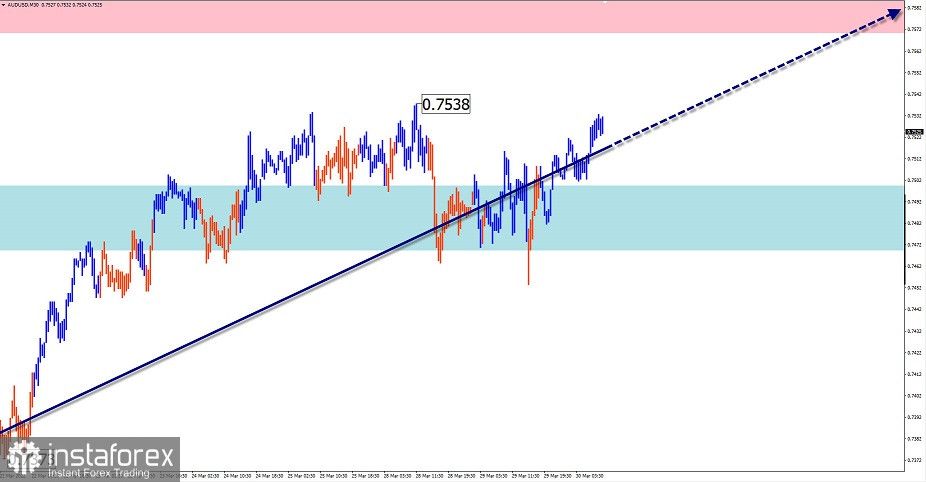
The rising wave of the Australian dollar major, which started at the beginning of this year, continues its formation. Quotes are approaching the lower boundary of a strong potential reversal zone of the weekly chart scale.
Forecast:
Today, the continuation of the general upward vector of price movement is most likely. In the first half of the day, a flat and a short-term decline in the support area is possible. The greatest activity can be expected by the end of the day or tomorrow.
Potential reversal zones
Resistance:
- 0.7570/0.7600
Support:
- 0.7500/0.7470
Recommendations:
There are no conditions for selling the Australian dollar today. At the ends of all counter kickbacks, purchases with a reduced lot are recommended.

USD/CHF
Analysis:
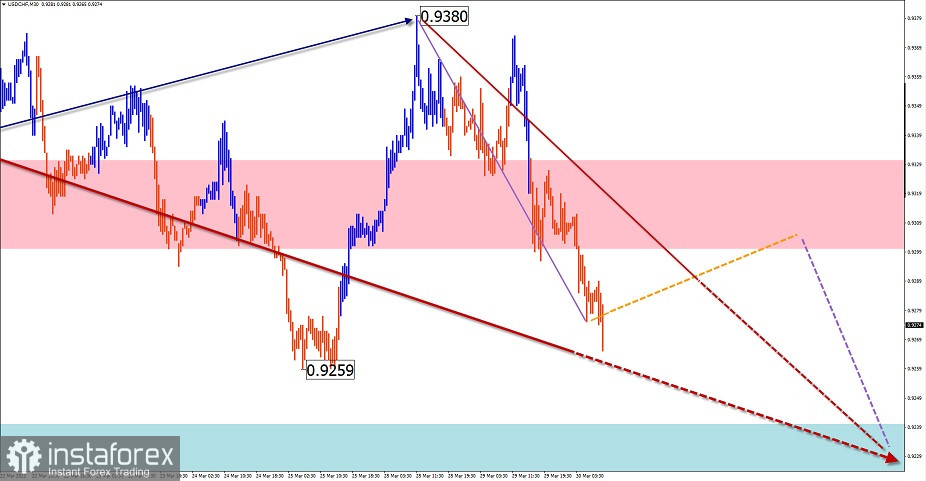
In the incomplete descending plane of the Swiss franc, the final part of the wave structure has been formed since March 16. In the structure of this wave, the middle part (B) ended the day before yesterday. The subsequent price decline led the quotes to the area of strong support.
Forecast:
The general flat mood of the movement is expected in the next trading sessions. In the first half of the day, a sideways course is more likely, an upward vector is possible. An increase in volatility and a resumption of the decline can be expected by the end of the day or tomorrow.
Potential reversal zones
Resistance:
- 0.9300/0.9330
Support:
- 0.9240/0.9210
Recommendations:
On the Swiss franc chart, purchases are very risky today and are not recommended. It is optimal to wait for the appearance of confirmed signals for the sale of the instrument in the area of the resistance zone.

Explanations: In the simplified wave analysis (UVA), waves consist of 3 parts (A-B-C). The last incomplete wave is analyzed. The solid background of the arrows shows the formed structure, and the dotted one shows the expected movements.
Attention: The wave algorithm does not take into account the duration of the movements of the instrument in time!


