


Trend analysis (Fig. 1).
The market may move up from the level of 1.3090 (close of yesterday's daily candle) to 1.3173, the 50.0% retracement level (red dotted line). In case of testing this level, the price may continue to move up with the target at 1.3202, the 61.8% retracement level (red dotted line). From this level, downward movement is possible.
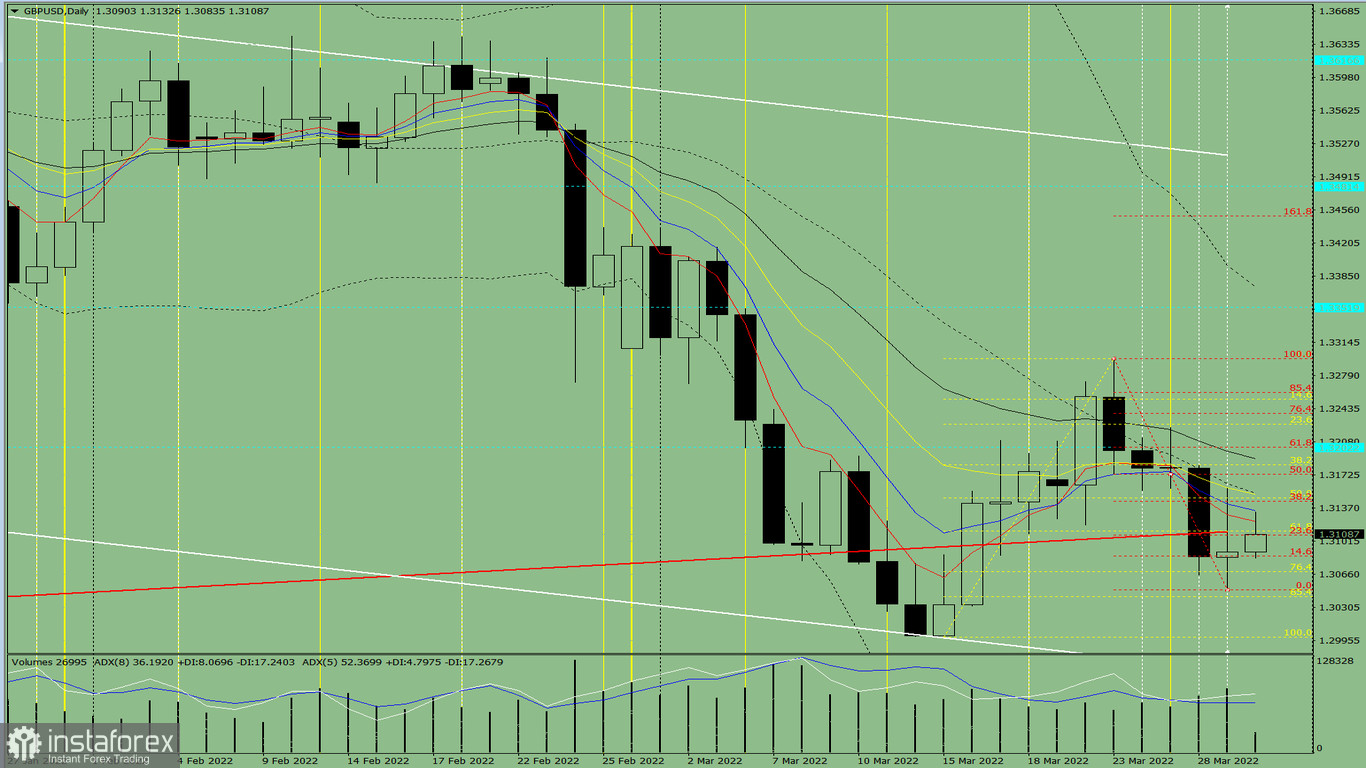
Fig. 1 (daily chart).
Comprehensive analysis:
- Indicator analysis - up;
- Fibonacci levels - up;
- Volumes - up;
- Candlestick analysis - up;
- Trend analysis - up;
- Weekly chart - up;
- Bollinger Bands – up.
General conclusion:
The price may move up from the level of 1.3090 (close of yesterday's daily candle) to 1.3173, the 50.0% retracement level (red dotted line). In case of testing this level, the price may continue to move up with the target at 1.3202, the 61.8% retracement level (red dotted line). From this level, downward movement is possible.
Unlikely scenario: from the level of 1.3090 (close of yesterday's daily candle), the price may move up to 1.3144, the 38.2% retracement level (red dotted line). In case of testing this level, the price may move downwards with the target at 1.3050, the lower fractal (red dotted line).


