Analysis of Thursday's deals:
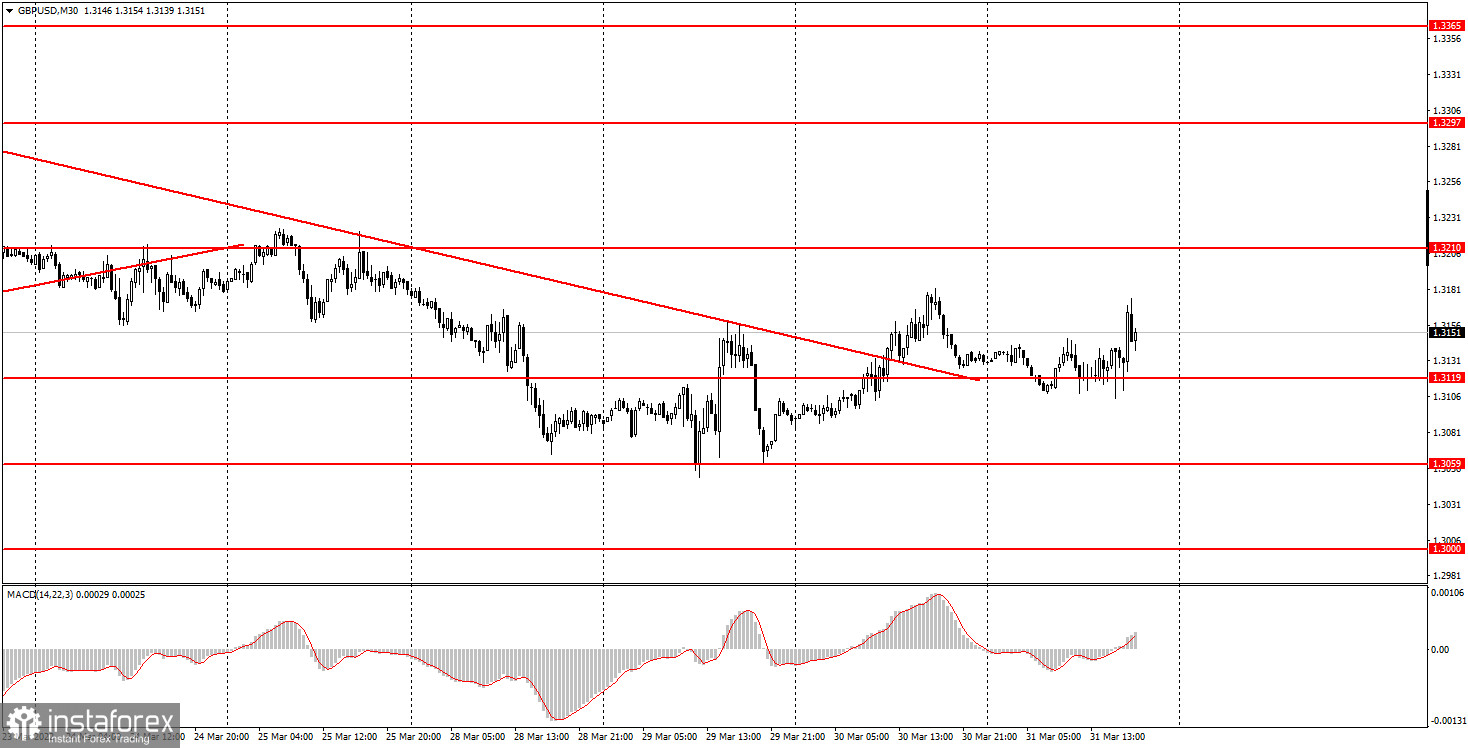
30M chart of the GBP/USD pair.

The GBP/USD pair traded more sideways on Thursday than up or down. In general, the British currency has not shown anything supernatural today. Thursday's volatility was about 70 points, which is not a lot and not a little. The pair managed to stay above the level of 1.3119, which is very important. There is currently no trend, trend line, or channel. Today, a report on GDP in the fourth quarter was published in the UK, which did not provoke any reaction from traders. The British currency reacted very weakly to the results of the next round of negotiations between Ukraine and Russia, which became known on Tuesday. In short, according to the theses, to sort out the whole situation with the pound, then it would look exactly like this. What's next? The pair bitterly managed to move away from its local lows near the level of 1.3059. And near the level of 1.3000 are the lows of the pair for the last 14-15 months. And since we have not yet seen strong growth of the pound, we can assume that its decline in the long term is not yet complete. It should also be noted that the price managed to gain a foothold above the trend line, but this did not provoke the British pound to grow.
5M chart of the GBP/USD pair.
In the 5-minute timeframe, the nature of the pair's movement on Thursday is even better visible. For most of the day, including overnight trading, the pair was between the levels of 1.3119 and 1.3156, only occasionally and briefly going slightly above or slightly below this area. Thus, formally, a lot of buy signals were formed today. Almost every rebound from the 1.3119 level could be used to open long positions. However, each time the price went up no more than 16 points and only in the middle of the American trading session managed to reach the nearest target level of 1.3156, which was located only 37 points. Thus, if novice traders opened long positions on any buy signal, they could earn a maximum of 20 points, since the long position should have been closed after a rebound/consolidation below the level of 1.3156. It was also possible to work out a sell signal near the level of 1.3156, but until the evening the pair failed to fall back to the level of 1.3119.
How to trade on Friday:
On the 30-minute TF, the pair has reversed the downward trend, so in the next few days, the pound may make new attempts to grow. However, the first day after overcoming the trend line passed without a clear advantage of the British currency. Therefore, the formation of a new upward trend is a big question. And today, a lot will depend on a new round of negotiations between Ukraine and Russia, as well as on American Nonfarm. Therefore, it is quite difficult to predict where both currency pairs will move. On the 5-minute TF tomorrow, it is recommended to trade by levels 1.3000, 1.3042, 1.3059, 1.3119-1.3126, 1.3156, 1.3210. When the price passes after the opening of the transaction in the right direction, 20 points should be set to Stop Loss at breakeven. The publication of a report on business activity in the manufacturing sector is scheduled for tomorrow in the UK. This is a secondary report in the current circumstances. Much more important will be the Nonfarm Payrolls report in the USA and the results of the next round of negotiations between Kyiv and Moscow. The unemployment rate for March will also be published in the States, but this report will still be in the shadow of more important data.
Basic rules of the trading system:
1) The strength of the signal is calculated by the time it took to generate the signal (rebound or overcoming the level). The less time it took, the stronger the signal.
2) If two or more trades were opened near a certain level on false signals, then all subsequent signals from this level should be ignored.
3) In a flat, any pair can form a lot of false signals or not form them at all. But in any case, at the first signs of a flat, it is better to stop trading.
4) Trade transactions are opened in the period between the beginning of the European session and the middle of the American session when all transactions must be closed manually.
5) On a 30-minute TF, signals from the MACD indicator can be traded only if there is good volatility and a trend, which is confirmed by a trend line or a trend channel.
6) If two levels are located too close to each other (from 5 to 15 points), then they should be considered as a support or resistance area.
What's on the chart:
Price support and resistance levels - target levels when opening purchases or sales. Take Profit levels can be placed near them.
Red lines - channels or trend lines that display the current trend and show in which direction it is preferable to trade now.
MACD indicator(14,22,3) - a histogram and a signal line - an auxiliary indicator that can also be used as a signal source.
Important speeches and reports (always contained in the news calendar) can greatly influence the movement of a currency pair. Therefore, during their exit, it is recommended to trade as carefully as possible or exit the market to avoid a sharp price reversal against the previous movement.
Forex beginners should remember that every trade cannot be profitable. The development of a clear strategy and money management are the keys to success in trading over a long time.


