Crypto Industry News:
Reserve Bank of India, India's central bank, announced on December 29 in its report that cryptocurrencies are highly volatile and show a high correlation with equities in a way that casts doubt on claims that virtual digital assets are an alternative source of value due to their alleged inflationary gains.
India's central bank has warned that policymakers around the world are concerned that the cryptocurrency sector could become more aligned with mainstream finance and "divert attention away from traditional finance with a wider impact on the economy."
The Central Bank of India is one of the most vocal critics of the cryptocurrency industry. Last week, RBI Governor Shaktikanta Das warned that private cryptocurrencies will cause another financial crisis if their use is not banned.
Technical Market Outlook:
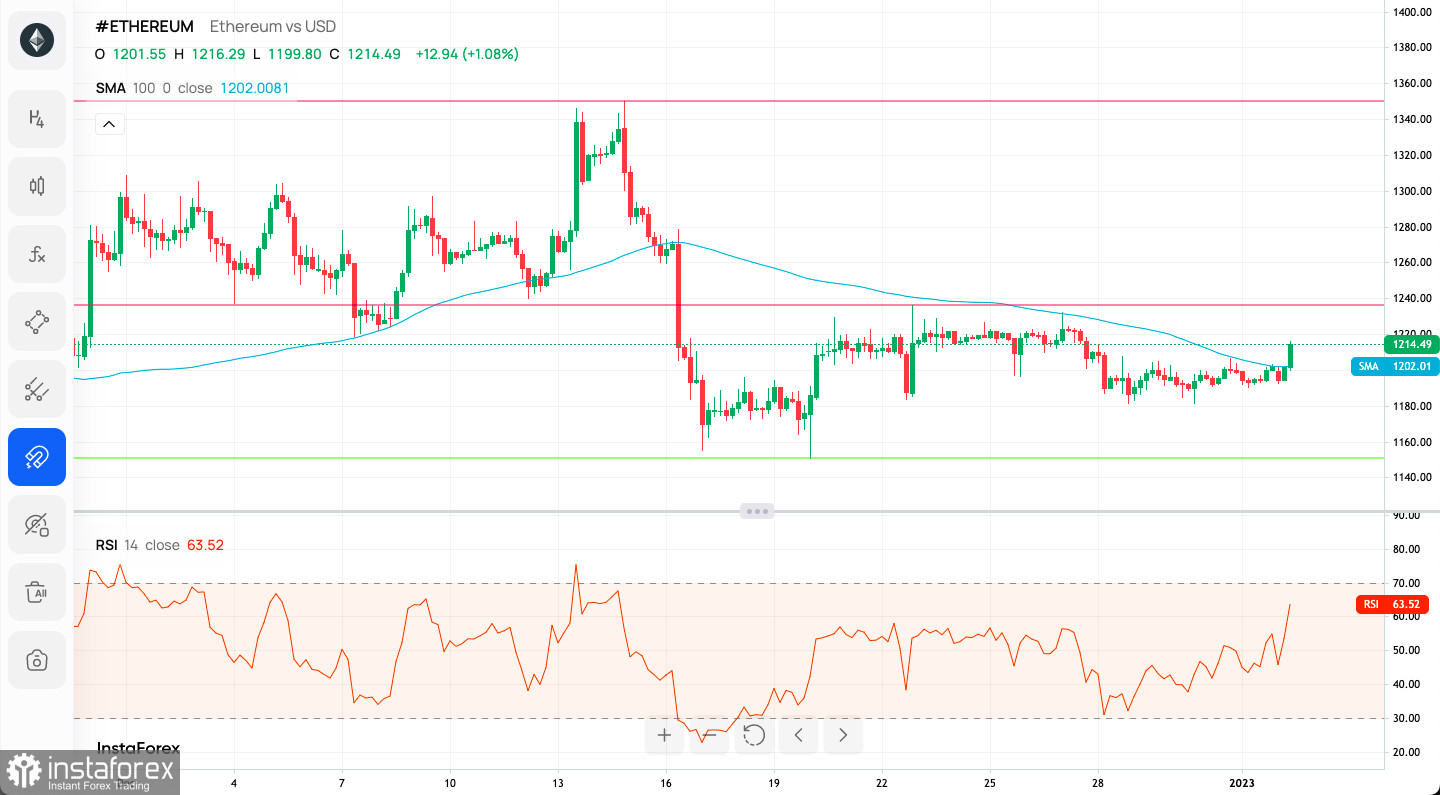
The Ethereum cryptocurrency has retraced 38% of the last wave down on the H4 time frame chart and is currently trading close to this level. The 100 SMA is seen at the level of $1,246, so bulls need to break through this level in order to continue the bounce towards the technical resistance seen at $1,278. The key short-term technical support is seen at the level of $1,183. Please notice the spike in the momentum indicator on the H4 time frame chart to the positive territory.

Weekly Pivot Points:
WR3 - $1,258
WR2 - $1,232
WR1 - $1,220
Weekly Pivot - $1,205
WS1 - $1,191
WS2 - $1,178
WS3 - $1,152
Trading Outlook:
The Ethereum market has been seen making lower highs and lower low since the swing high was made in the middle of the August 2022 at the level of $2,029. The key technical support for bulls at $1,281 was broken already and the new swing low was established at $1,074. There is a clear test of the 50 WMA located at the level of $1,080, so any breakout below the moving average and a weekly candle close below moving average will be considered as another indication of the down trend continuation. If the down move will be extended, then the next target for bears is located at the level of $1,000.


