


Trend analysis (Fig. 1).
The market may move down from the level of 1.1046 (close of Friday's daily candle) to the target of 1.1036, the 61.8% retracement level (yellow dotted line). In case of testing this level, the price may continue to move downward with the target of 1.1001, the 76.4% retracement level (yellow dotted line). After testing this level, the price may move up to the target of 1.1082, the historical resistance level (blue dotted line).
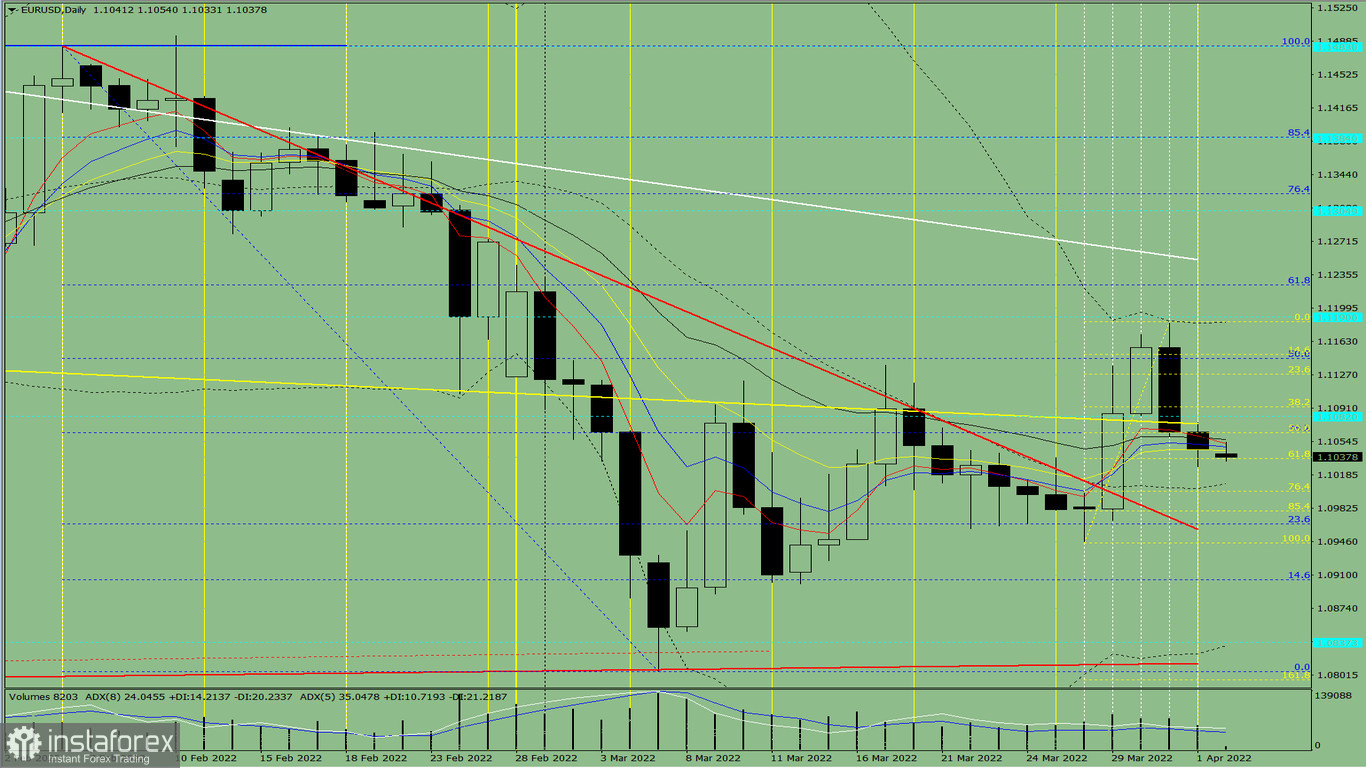
Fig. 1 (daily chart).
Comprehensive analysis:
- Indicator analysis - down;
- Fibonacci levels - down;
- Volumes - down;
- Candlestick analysis - down;
- Trend analysis - up;
- Bollinger bands - up;
- Weekly chart - up.
General conclusion:
The price may move down from the level of 1.1046 (close of Friday's daily candle) to the target of 1.1036, the 61.8% retracement level (yellow dotted line). In case of testing this level, the price may continue to move downward with the target of 1.1001, the 76.4% retracement level (yellow dotted line). After testing this level, the price may move up to the target of 1.1082, the historical resistance level (blue dotted line).
Alternative scenario: from the level of 1.1046 (close of Friday's daily candle), the price may move downward with the target of 1.1036, the 61.8% retracement level (yellow dotted line). After testing this level, the price may move upward with the target of 1.1082, the historical resistance level (blue dotted line).


