


Trend analysis
EUR/USD will attempt to move up this week, from 1.1046 (closing of the last weekly candle) to the historical resistance level at 1.1174 (blue dotted line). Then, it will go to the higher resistance level at 1.1305 (dashed blue line).
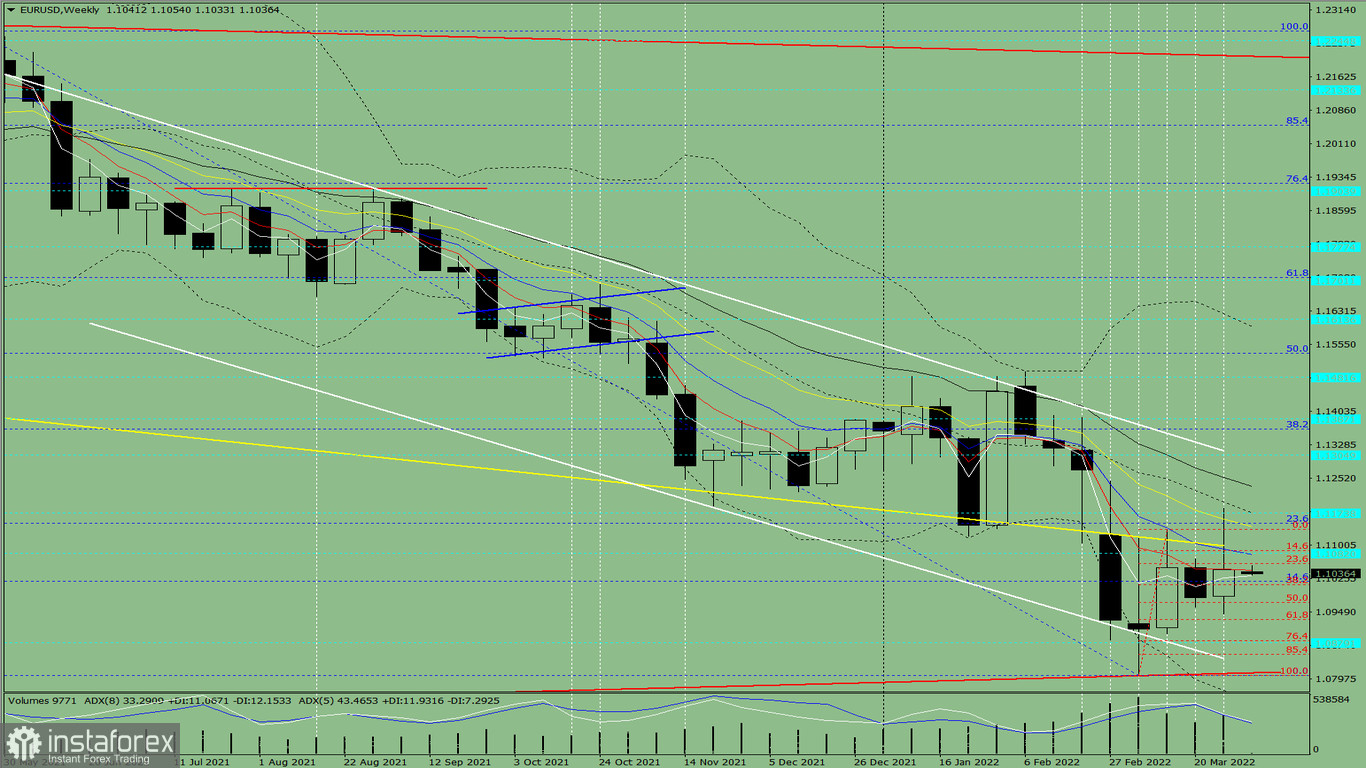
Fig. 1 (daily chart)
Comprehensive analysis:
Indicator analysis - uptrend
Fibonacci levels - uptrend
Volumes - uptrend
Candlestick analysis - uptrend
Trend analysis - uptrend
Bollinger bands - uptrend
Monthly chart - uptrend
All this points to an upward movement in EUR/USD.
Conclusion: The pair will have an upward trend, with no first lower shadow on the weekly white candle (Monday - up) and no second upper shadow (Friday - up).
And during the week, the price will rise from 1.1046 (closing of the last weekly candle) to the historical resistance level at 1.1174 (blue dotted line), then move to the higher resistance level at 1.1305 (dashed blue line).
Alternatively, the quote could attempt to move down from 1.1046 (closing of the last weekly candle) to the lower fractal at 1.0806 (dashed blue line), then bounce back to the 14.6% retracement level at 1.1019 (dashed blue line).


